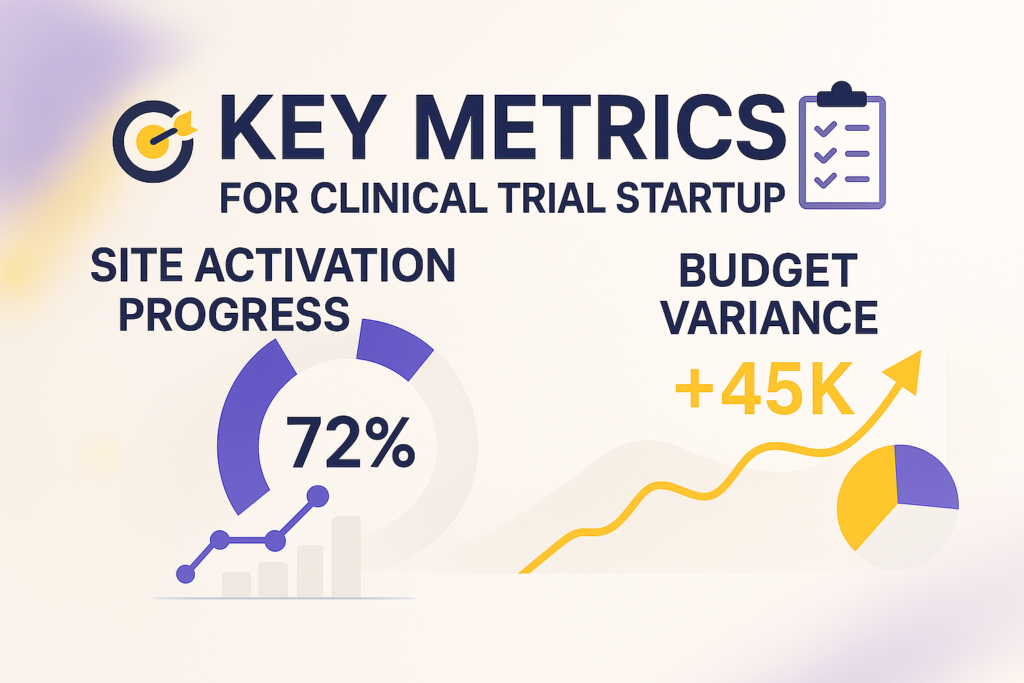
Visualize your study startup like a high-performance dashboard—not a pile of spreadsheets.
The harsh truth? 80% of clinical trials experience delays during the star-up phase, often by weeks or even months. According to data from ClinicalTrials.gov, these delays cost sponsors millions in lost time, opportunity, and resourcing.
And yet, many teams are still operating like it’s 2005.
The Reality Check
You’re probably thinking: “We track our metrics already.” But here’s what we commonly hear from clinical research professionals:
“We spend hours compiling reports from different spreadsheets…”
“By the time we identify a bottleneck, it’s too late…”
“We spend hours compiling reports from different spreadsheets…”
Sound familiar? You’re not alone.
These aren’t isolated complaints—they’re industry-wide patterns that are slowing down trials across the board.
Why This Matters Now More Than Ever
The start-up phase isn’t just the beginning of your trial—it often determines how fast (or how painfully slow) the rest of the study will move.
And in today’s environment, the pressure has never been greater:
- Protocol complexity has increased by over 50% in the past decade
- Trial start-up costs now exceed $2M on average
- Speed-to-market can directly impact revenue, funding, and market advantage
- Global operations mean more stakeholders, more variability, more risk
Trying to manage this with disconnected spreadsheets is like navigating a ship with a paper map in the age of GPS.
What Modern Digital Solutions Offer:
✅ Real-time metric tracking
✅ Automated data capture and updates
✅ Predictive analytics to spot delays before they happen
✅ Standardized workflows across teams and regions
✅ Cross-functional transparency and faster decision-making
Now, let’s explore the five critical metrics that can make or break your study startup phase.
The 5 Key Metrics That Matter
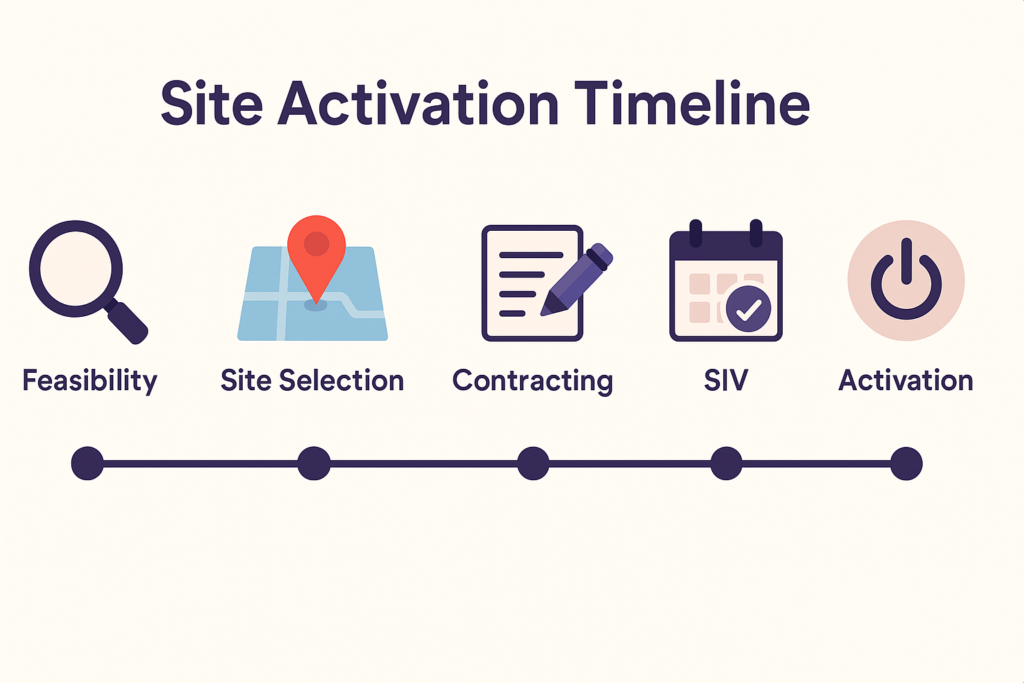
1. Site Activation Timeline – Your Early Warning System
If there’s one place startup delays almost always begin, it’s here.
Site activation delays are the #1 reason trials fall behind schedule. Why? Because this step touches nearly every function—feasibility, contracting, regulatory, and operations.
Even a small delay compounds: a 2-week slip at just 20% of your sites can push back your enrollment timeline by months. That’s real cost, real risk, and real frustration.
What to Measure:
- Time from site identification to full activation
- Duration of each milestone: feasibility review, site selection, contract execution, site initiation visit
- Site-by-site performance variability
- Cycle time benchmarks based on study type and region
🧠 Benchmark Insight:
Top-performing organizations activate sites in 90–120 days. The industry average? 170+ days—nearly double in some regions.
How to Track It Effectively:
- Break activation into clearly defined stages with owners
- Set target dates and monitor slippage by milestone
- Compare site performance in real-time dashboards
- Use historical data to establish achievable timelines
💡 Pro Tip: Use a centralized dashboard that flags any site falling behind on its timeline. It acts like a GPS alert—showing you where to course-correct before enrollment stalls.
🟣 Why It Matters
With a clear site activation timeline, you don’t just spot delays—you stop them before they happen.
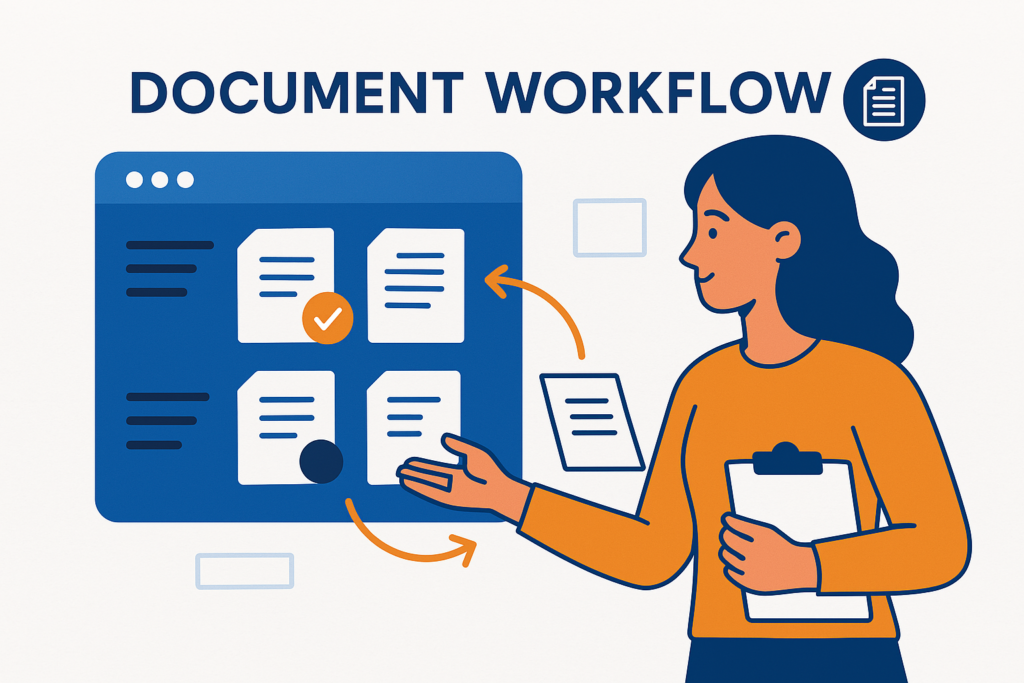
2. Document Processing Efficiency – Speed Without Sacrificing Accuracy
Let’s be honest—regulatory document handling is rarely exciting. But in clinical trial startup, it’s often the silent bottleneck that quietly eats up weeks of time.
These documents are the foundation of regulatory compliance—and the #2 reason trials fall behind before enrollment even begins.
What to Measure:
- Time to complete full regulatory document packages
- Document rejection and revision rates
- Turnaround time for sponsor and site reviews
🧠 ACRP Insight:
Inefficient document workflows add an average of 43 days to study startup timelines.
Digital Transformation in Action:
Organizations that implement electronic document management systems (eDMS) report:
- ✅ 35% faster document completion
- ✅ 42% reduction in query resolution time
- ✅ 58% improved compliance with document standards
How to Elevate Your Document Workflow:
- 🔄 Implement electronic routing with automated reminders
- 👀 Track document status and ownership in real-time dashboards
- 🧾 Analyze common rejection reasons to improve template design
- 🗂 Standardize naming conventions for traceability and audit readiness
💡 Pro Tip: Use conditional logic in forms (e.g., hide/show sections based on previous answers). This can cut document errors by 27% and reduce completion time by 41%.
🟣 Why It Matters
The longer you wait on paperwork, the more your timeline drifts. Digitizing documentation is one of the fastest ways to unlock speed—and ensure compliance.
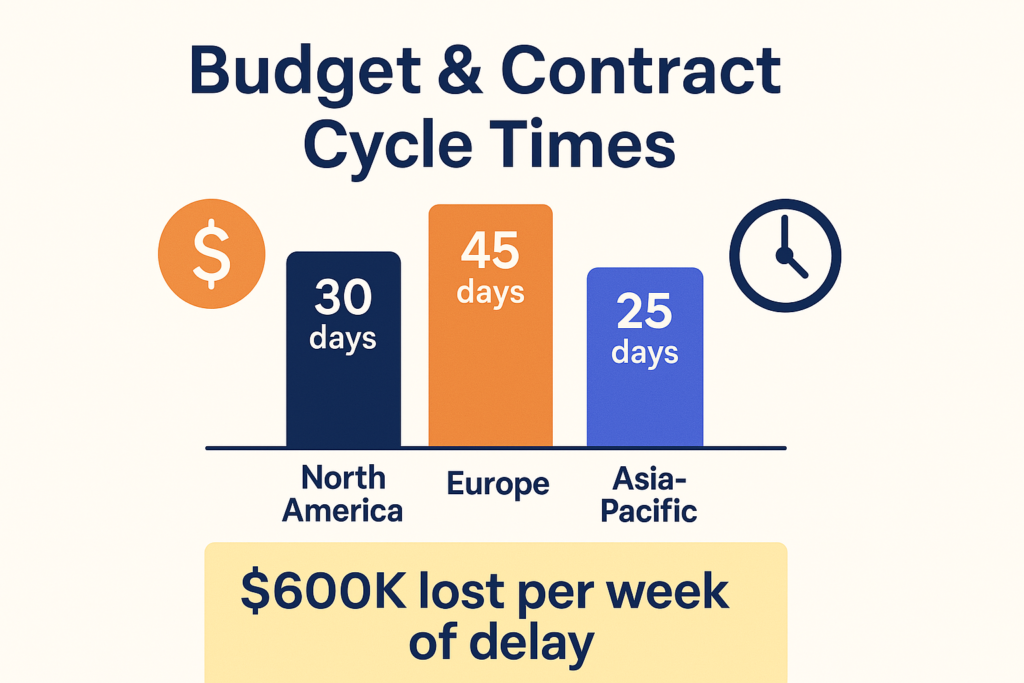
3. Budget and Contract Cycle Times – The Silent Time Sink
Nothing can quietly derail a study startup quite like a sluggish budget or contract negotiation. And yet, many teams still manage these workflows through email chains, spreadsheets, and “version_12_final_FINAL.docx” attachments.
The cost of delay is massive: in a Phase III trial, each week lost in contract negotiations can mean over $600,000 in operational costs and missed revenue opportunity.
What to Measure:
- Time from budget initiation to final contract approval
- Number of review/revision cycles
- Use of standard contract templates
- Variance between initial and final approved budget
📊 By the Numbers – Average Contract Completion Times:
- North America: 30 days
- Europe: 45 days
- Asia-Pacific: 25 days
How to Streamline the Process:
- 🔁 Move negotiations to a centralized digital platform
- 📄 Use pre-approved contract language libraries to reduce redlining
- ⏱ Track stakeholder response times to identify slow points
- 🔃 Implement parallel review processes when possible
💡 Pro Tip: Digital contract management platforms can reduce negotiation time by 52% and cut internal email volume by 73%.
🟣 Why It Matters
Contracts are the bridge between planning and execution. The faster you close them, the sooner your trial moves forward.
4. Stakeholder Response Times – Your Trial Moves at the Pace of People
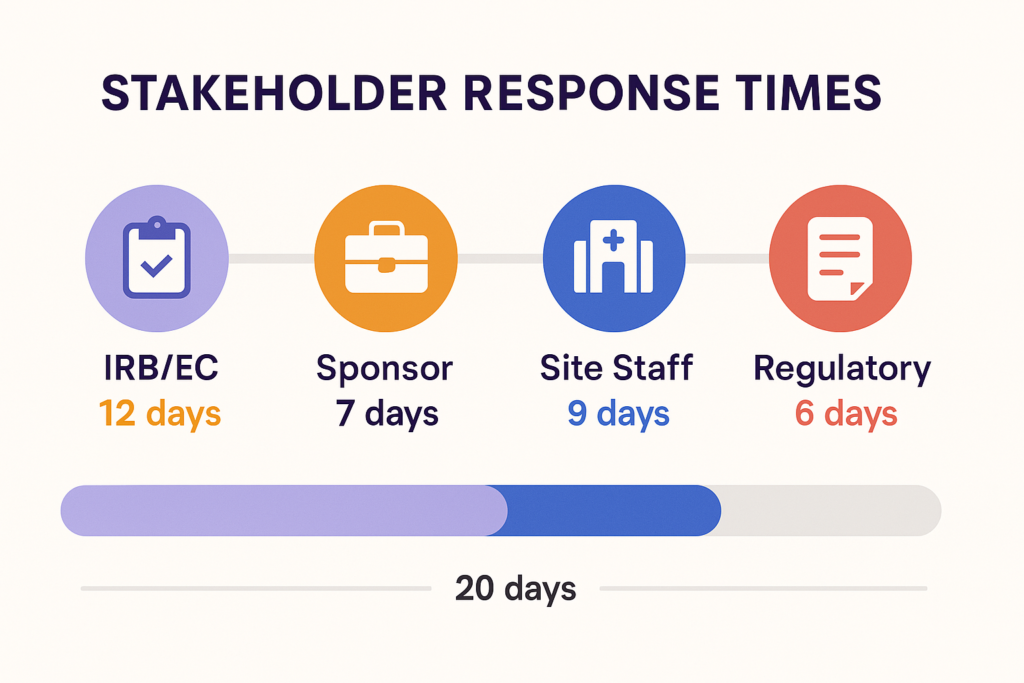
In many studies, the slowest part of startup isn’t technical—it’s people.
Delayed responses from sponsors, IRBs, or sites often go unnoticed until they pile up into real schedule slippage. In fact, up to 60% of study startup delays are caused by communication bottlenecks.
What to Measure:
- Time from IRB/EC submission to approval
- Sponsor response time to site queries
- Site response time to sponsor requests
- Amendment turnaround times
⏱ The Communication Gap:
Most delays aren’t scientific—they’re operational. A day here, a week there—and suddenly you’re a month behind.
How to Improve Response Time Performance:
- 📬 Set clear expectations for response time by role
- 🔔 Use automated reminders and alerts for overdue items
- 📈 Track historical responsiveness by stakeholder type
- 🚨 Establish escalation paths for delayed responses
💡 Pro Tip: Add response time metrics to your monthly site reports. Just knowing they’re being measured often improves turnaround times.
🟣 Why It Matters
Your study timeline is only as strong as its slowest responder. Speed is a team sport—make sure everyone’s on the clock.
5. Resource Utilization – Where Is Your Startup Time Going?
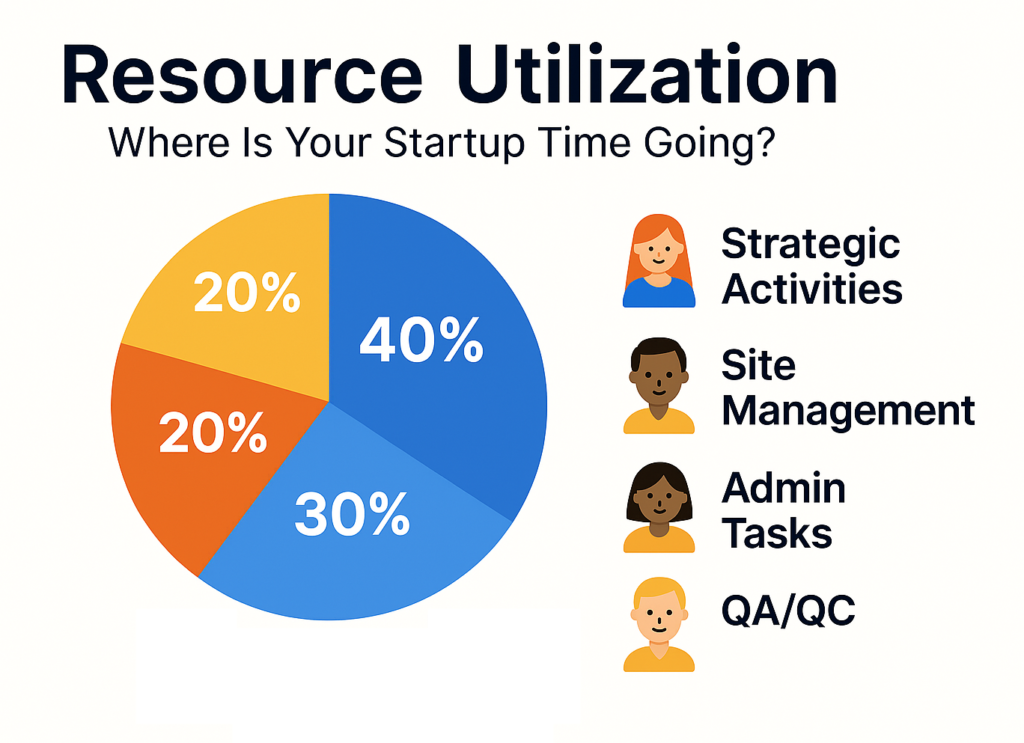
Clinical trial startup is resource-intensive—but few teams can clearly answer where their time is actually being spent.
The reality? Many teams spend up to 60% of their time on administrative tasks—things that could be automated, delegated, or optimized.
What to Measure:
- Time allocation across key startup activities
- Ratio of value-added vs. administrative work
- Bottlenecks due to understaffing or uneven workloads
- Cross-functional dependencies that slow things down
📊 Optimal Time Allocation in High-Performing Teams:
- Strategic Activities: 40%
- Site Management: 30%
- Admin Tasks: 20%
- QA/QC: 10%
How to Optimize Resource Allocation:
- ⏱ Track team time by category or task type
- 🔄 Identify repetitive or manual tasks that could be automated
- 🌡 Monitor workload distribution to avoid burnout and bottlenecks
- 🧭 Build capacity planning models based on historical startup data
💡 Pro Tip: Use a team workload heatmap to see who’s overloaded—and rebalance before timelines start slipping.
🟣 Why It Matters
Your people are your most valuable asset. Make sure their time is spent driving progress—not just checking boxes.
Making the Digital Transition: Where to Start
You don’t have to overhaul your entire system overnight. The most successful teams start small—and scale with intention.
Here’s a simple framework to begin your digital transition:
- 🔍 Audit your current processes
Identify where delays and inefficiencies are costing you the most. - 🎯 Choose one high-impact metric to digitize
Don’t try to do it all at once. Start with what hurts most—site activation, document turnaround, etc. - 📊 Establish a baseline
Know your numbers before you implement change. That’s how you’ll measure real ROI. - 🤝 Involve cross-functional teams early
Bring in Ops, Regulatory, and Site Management to ensure buy-in and adoption. - 📣 Make metrics visible
Use dashboards, reports, and alerts that keep everyone on the same page—literally.
💡 Digital transformation doesn’t start with tech. It starts with visibility, alignment, and measurement.
Real-World Impact: A Mini Case Study
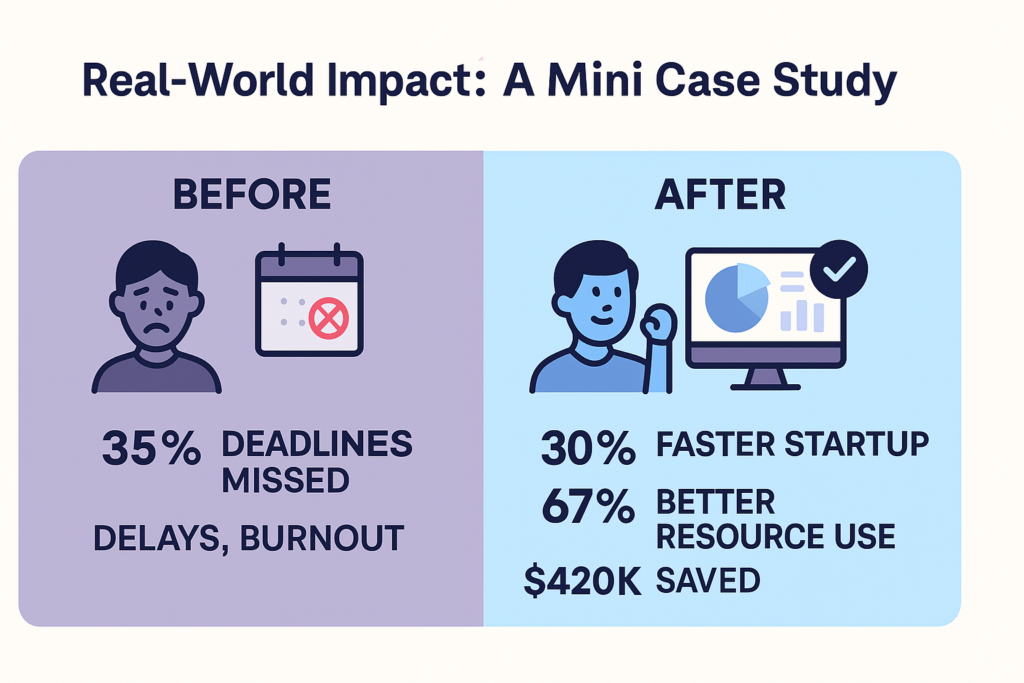
Before implementing digital tracking, a mid-sized CRO was missing study start-up deadlines by over 35%. Sponsors were frustrated, teams were burned out, and timelines kept slipping.
They rolled out a centralized, real-time dashboard to track all five metrics outlined above—and the impact was immediate:
- 🔽 30% reduction in overall star-up timeline
- 🔽 42% decrease in document processing time
- 🔼 67% improvement in resource utilization
- 💰 $420K saved per study in operational overhead
Most importantly, their reputation shifted from “always behind” to “always ready.”
How Are You Tracking Start-up Success?
Modernizing your study start-up doesn’t have to be overwhelming. Whether you’re trying to reduce contract cycle times or eliminate document bottlenecks, the key is starting with the right metrics—and building from there.
We’d love to hear what metrics you’re using, what’s working—and what’s not.
Let’s start the conversation. Contact us


