
Quick Answer
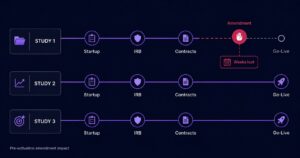
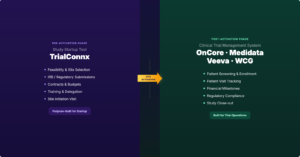
Study startup delays don’t happen during the work—they happen between tasks, while waiting for stakeholders, and when rushing unprepared submissions. The five metrics that actually predict timeline overruns are: Handoff Latency (idle time between stages), Activity Cycle Time (bottlenecks within stages), Stakeholder Response Time (external party delays), Pre-Submission Readiness Rate (on-time preparation quality), and Feasibility Completeness Score (submission completeness). Sites tracking these predictive metrics see significantly reduced startup timelines compared to those monitoring only milestone completion dates.
Quick Navigation
The Problem: Why Traditional Metrics Fail
The Startup Delay Crisis
of trials miss enrollment timelines
months median activation time
of trial time is startup
80% of clinical trials fail to meet enrollment targets on time, with study startup accounting for 61% of total trial duration1. Yet when you ask study startup teams what went wrong, they point to the same culprit: “waiting.”
Waiting for contracts. Waiting for IRB responses. Waiting for feasibility answers. Waiting for someone to start the next stage.
The real issue isn’t how long tasks take—it’s what happens between tasks.
The Vanity Metrics Trap
Most sites track what we call “vanity metrics”:
- Days to site selection
- Days to contract execution
- Days to IRB approval
- Days to first patient screened
These milestone-based metrics tell you when you’re late, not why you’re late or how to prevent it.
❌ Tracking Only Milestones
9.4 months typical activation
Reactive problem-solving
✅ Tracking Predictive Metrics
Significantly faster activation
Reduced idle time and delays

What You Can’t See, You Can’t Fix
The five metrics below are different. They’re leading indicators that:
- Reveal bottlenecks before they compound into delays
- Are instrumentable in your current workflow
- Provide actionable intervention points
- Correlate directly with on-time activation rates
Let’s break down each one.
Metric #1: Handoff Latency (Stage→Stage)
What It Is
Handoff Latency is the average elapsed time between finishing one stage and starting the next.
Example: Site selection letter received March 15, 3:00 PM → Study documents received from sponsor March 29, 2:00 PM = 13.8 days handoff latency
Why It Matters More Than You Think
Hidden idle time kills timelines more than the work itself.
The Compounding Effect: Handoff delays compound. 3 days lost at feasibility → contracts, 4 days at contracts → IRB, 5 days at IRB → activation = 12 days of pure idle time. Yet your milestone tracker shows “IRB phase took 23 days”—hiding where the real problems are.
Why Traditional Metrics Miss This
✅ What Traditional Metrics Capture
- When site was selected
- When contracts were executed
❌ What They Miss
- The 14-day gap waiting for documents
- Why that gap existed
- Who/what was blocking the handoff
How to Measure in TrialConnX
Define Stage Completion Events
Each workflow stage has a clear “Done” status. Mark completion timestamp when all stage deliverables are ready.
Define Stage Start Events
Next stage officially starts when work begins (not when calendar passes). First action timestamp = stage start.
Calculate Latency
Set SLA Thresholds
- Site Selection → Documents Received: ≤ 5 business days
- Documents Received → IRB Submission: ≤ 7 business days
- IRB Approval → First Patient Ready: ≤ 3 business days
Weekly Reporting
Flag any handoff exceeding SLA. Track trend: improving or degrading? Root cause analysis on outliers.
Real-World Example
📋 Case Study: Academic Medical Center, Oncology Trial
Before Tracking
- Average activation: 89 days
- Team blamed “slow IRB” and “complex contracts”
- No visibility into idle time
After Implementation
- Discovered: 18 days latency between site selection → documents sent to site
- Root cause: Study documents sat in sponsor team’s shared folder
- Fix: Automated notifications to sponsor when site is selected
💰 Result
Reduced handoff from 18 days → 2.3 days
New average activation: 73 days (18% improvement)
Industry Benchmarks
| Handoff Type | High Performers | Average | Underperformers |
|---|---|---|---|
| Site Selection → Documents Received | ≤ 5 days | 10-14 days | >20 days |
| Documents Received → IRB Submission | ≤ 7 days | 14-21 days | >30 days |
| IRB Approval → First Patient Ready | ≤ 3 days | 7-10 days | >14 days |
Target: Keep all handoffs in “High Performer” range.

Metric #2: Activity Cycle Time by Stage
What It Is
Activity Cycle Time measures how long individual activities take to move from “to-do” to “completed” within each workflow stage.
Example: Activity “Complete PI qualification form” changed to “Working” March 15, 9:00 AM → “Completed” March 18, 2:00 PM = 3.2 days activity cycle time
Why It Matters More Than You Think
Long cycle times within stages reveal hidden capacity constraints and process inefficiencies.
While handoff latency tracks delays between stages, activity cycle time reveals bottlenecks within stages. An activity that should take 2 days but takes 8 days signals a problem—whether it’s unclear ownership, missing information, or competing priorities.
The Visibility Problem: Analysis of TrialConnX platform data shows that the average activity cycle time for “Budget template completion” is 6-8 days, but actual work time is typically only 2-3 hours. That means approximately 95% of the “cycle time” is waiting, context-switching, or unclear ownership.
Hidden Patterns Revealed
- Activities stuck in “Working” status for days without progress
- Tasks that repeatedly move from “Working” → “Negotiating” → back to “Working”
- Certain activity types that consistently take 3x longer than they should
- Stage-specific bottlenecks that compound downstream
Why Traditional Metrics Miss This
✅ What Traditional Metrics Capture
- Feasibility stage started: March 1
- Feasibility stage completed: March 15
❌ What They Miss
- Which activities within Feasibility took longest
- How long activities sat in “to-do” before someone started them
- Which activities stalled in “working” or “negotiating” status
- Patterns that predict which protocols will struggle
How to Measure in TrialConnX
Track Status Transitions
TrialConnX tracks each activity’s status: “to-do” → “working” → “negotiating” → “completed”. Capture timestamp for each status change and calculate time spent in each status.
Calculate Cycle Time by Status
Active Time = Time in “working” status
Negotiation Time = Time in “negotiating” status
Total Cycle Time = Queue + Active + Negotiation
Set Stage-Specific Benchmarks
- Feasibility activities: ≤ 3 days average cycle time
- Budget activities: ≤ 4 days average cycle time
- Contract activities: ≤ 5 days average cycle time
- IRB prep activities: ≤ 4 days average cycle time
Identify Outliers
Flag activities exceeding 2x expected cycle time. Track patterns: Is it always the same activity type? Root cause analysis: Why is this taking so long?
Weekly Dashboard Review
- Which activities are stuck in “working” for >3 days?
- Which activities keep bouncing between statuses?
- Which stages have the highest average cycle times?
Real-World Example
📋 Case Study: Academic Medical Center, Oncology Trial
Before Tracking Activity Cycle Time
- Feasibility stage taking 22 days on average
- Team assumed “it’s just complex”
- No visibility into specific bottlenecks
After Implementation
- Discovered: “PI qualification documentation” averaged 11.3 days
- Root cause: Activity sat in “to-do” for 8 days waiting for admin assistant
- Other activities in same stage averaged only 2.4 days
💰 Result
Reassigned PI documentation to coordinator role (freed from admin dependency). Set up automated reminder when activity in “to-do” for >2 days.
PI qualification cycle time: 11.3 days → 2.8 days (75% reduction)
Overall feasibility stage: 22 days → 13 days (41% improvement)
Industry Benchmarks
| Stage | Activity Type | High Performers | Average | Underperformers |
|---|---|---|---|---|
| Feasibility | Data collection | ≤ 2 days | 4-6 days | >8 days |
| Budget | Template completion | ≤ 3 days | 5-7 days | >10 days |
| Contracts | Internal review cycles | ≤ 4 days | 6-9 days | >12 days |
| IRB | Document preparation | ≤ 3 days | 5-8 days | >10 days |
Target: Keep 80% of activities within “High Performer” range for cycle time.

Metric #3: Stakeholder Response Time
What It Is
Stakeholder Response Time measures how long external parties (sponsor, CRO, vendors, PI) hold the ball before responding or taking action.
Example: Sent budget draft to Sponsor March 15, 2:00 PM → Sponsor returned with feedback March 22, 10:00 AM = 6.8 days stakeholder response time
Why It Matters
You can’t control external parties, but you CAN measure and manage them.
The majority of study startup delays aren’t caused by your team’s work—they’re caused by waiting for external stakeholders to respond. Yet most sites have zero visibility into these delays.
days avg. with sponsor
days avg. with CRO
days pure waiting time
The Accountability Gap
Without tracking who has the ball, teams make incorrect assumptions:
❌ Common Misperception
“Contracts are taking forever”
Reality: 80% of time waiting for sponsor responses
❌ Common Misperception
“Our team is slow”
Reality: Your team’s work time is 12 days, sponsor hold time is 31 days
❌ Common Misperception
“IRB prep is delayed”
Reality: Waiting 9 days for PI to review informed consent
Why Traditional Metrics Miss This
✅ What Traditional Metrics Capture
- Contract negotiation started: March 1
- Contract executed: April 15
- Total time: 45 days
❌ What They Miss
- How much time was “with sponsor” vs. “with site”
- Which stakeholders are slowest to respond
- How many days your team was blocked waiting
- Whether delays are internal or external
How to Measure in TrialConnX
Track “Currently With” Status
TrialConnX’s “currently with” feature tracks which party has the ball: Sponsor, CRO, Site/Coordinator, PI, IRB, Vendor. Capture timestamp each time ball changes hands.
Calculate Hold Time by Party
Hold Time = Timestamp (Ball Returned) – Timestamp (Ball Sent)
Example:
– March 15: Ball → Sponsor
– March 22: Ball → Site
– Sponsor Hold Time: 7 days
Segment by Stakeholder Type
- Average response time by Sponsor
- Average response time by CRO
- Average response time by PI
- Average response time by Vendor
Set Accountability SLAs
- Sponsor/CRO responses: ≤ 5 business days
- PI responses: ≤ 3 business days
- Site internal responses: ≤ 2 business days
- Flag any stakeholder exceeding 2x their SLA
Weekly Escalation Report
- Which protocols are currently blocked? With whom?
- How long has each party held the ball?
- Which stakeholders consistently miss SLAs?
Real-World Example
📋 Case Study: Community Hospital Network, 6 Concurrent Protocols
Before Tracking Stakeholder Response Time
- Blamed “slow contracting process” for delays
- No visibility into where delays actually occurred
- Average startup: 94 days
After Implementation
- Discovered 94-day breakdown:
- Site work time: 23 days (24%)
- Sponsor hold time: 38 days (40%)
- CRO hold time: 19 days (20%)
- PI hold time: 14 days (15%)
Key insight: 75% of delays were external, not internal.
💰 Result
Proactively followed up when sponsors held ball >5 days. Set up automated PI reminders. Shared data with sponsors showing their 8.2-day avg. vs. site’s 2.1-day avg.
Sponsor response time: 8.2 days → 4.9 days (40% reduction)
Overall startup time: 94 days → 71 days (24% improvement)
Bonus: Team morale improved—they could prove delays weren’t their fault
Industry Benchmarks
| Stakeholder | High Performers | Average | Underperformers | Red Flag |
|---|---|---|---|---|
| Sponsor | ≤ 4 days | 6-8 days | 10-15 days | >15 days |
| CRO | ≤ 3 days | 5-7 days | 8-12 days | >12 days |
| PI | ≤ 2 days | 4-5 days | 6-8 days | >8 days |
| Vendor | ≤ 3 days | 5-7 days | 8-10 days | >10 days |
Target: Keep all stakeholder response times within “High Performer” range.

Metric #4: Pre-Submission Readiness Rate
What It Is
Pre-Submission Readiness Rate measures the percentage of activities completed on-time before key submission deadlines (contracts, IRB, activation).
Example: IRB submission deadline March 30 → 15 required activities → 13 completed by deadline, 2 completed late = 87% readiness rate (13/15)
Why It Matters
Late preparation compounds into submission delays and quality problems.
Most teams track if submissions happen, but not whether preparation was on-time. When teams rush to meet deadlines, they submit incomplete materials, skip quality reviews, burn out staff, and miss coordination opportunities.
more errors when rushed
days added to timeline
staff turnover when rushed
Platform data shows: Sites with >90% readiness rate average significantly faster activations than those with <70% readiness rate. Higher preparation quality correlates with reduced startup time.
Why Traditional Metrics Miss This
✅ What Traditional Metrics Capture
- IRB submitted: Yes/No
- Submission date
- Approval date
❌ What They Miss
- Were all prep activities completed on-time?
- How many activities were rushed in the final days?
- Which activities consistently run late?
- Are deadlines realistic or aspirational?
How to Measure in TrialConnX
Set Activity Due Dates
For each major submission (contracts, IRB, activation), define required prep activities and assign due dates to each activity (ideally 2-3 days before submission deadline).
Example IRB Submission Prep:
- Protocol summary (Due: 10 days before submission)
- Informed consent draft (Due: 8 days before)
- Recruitment materials (Due: 7 days before)
- PI CV and certifications (Due: 5 days before)
- Quality review (Due: 2 days before)
Track On-Time Completion
– If completed ≤ due date → On-Time
– If completed > due date → Late
– If not completed by submission → Missing
Readiness Rate = (On-Time / Total) × 100
Identify Late Patterns
- Which activity types are consistently late?
- Which stages have lowest readiness rates?
- Which coordinators/PIs have best on-time rates?
Set Readiness Thresholds
- ≥ 95% readiness: Green light to submit
- 85-94% readiness: Yellow flag, review what’s missing
- < 85% readiness: Red flag, delay submission or escalate
Weekly Readiness Dashboard
- Upcoming submissions in next 14 days
- Current readiness rate for each
- Activities at risk of missing deadlines
- Early warning system for interventions
Real-World Example
📋 Case Study: Academic Medical Center, Multi-Therapeutic
Before Tracking Readiness
- Frequent last-minute scrambles before submissions
- IRB submissions often delayed by 3-7 days
- Average time to IRB approval: 67 days
- High coordinator stress and burnout
After Implementation
- Discovered: Average readiness rate was only 64%
- Root causes: PI review late (58%), budget rushed (48%), consent drafts missed (42%)
- Set earlier internal deadlines (3-day buffer)
- Implemented “no submit if <85% ready” rule
💰 Result
Readiness rate: 64% → 91%
IRB submission delays: Reduced by 78%
Documents requiring revision: Reduced by 52%
Average time to IRB approval: 67 days → 51 days (24% improvement)
Bonus: Coordinator stress surveys showed 47% improvement in “reasonable workload”
Industry Benchmarks
| Readiness Rate | Category | Submission Delays | Avg. Error Rate | Timeline Impact |
|---|---|---|---|---|
| > 90% | Excellent | < 5% | < 8% | Minimal |
| 80-90% | Good | 10-15% | 12-18% | +5-8 days |
| 70-80% | Fair | 20-30% | 20-28% | +10-15 days |
| < 70% | Poor | 35%+ | 30%+ | +20+ days |
Target: Maintain ≥ 88% readiness rate across all submissions.
Metric #5: Feasibility Completeness Score
What It Is
Feasibility Completeness Score measures the percentage of required fields completed correctly on first submission.
Why It Matters
Incomplete first passes trigger clarification requests and stall every downstream task.
Feasibility isn’t just a formality—it’s the foundation for every subsequent stage. Contracts reference feasibility capabilities. IRB assesses feasibility population estimates. Budget builds on feasibility resource requirements.
Cascading Delays from Incomplete Feasibility
Contracts Delayed
+5-8 days for clarifications
IRB Questions
+12-18 days for additional info
Budget Re-negotiation
+7-14 days for revisions
Real-World Example
📋 Case Study: 8-Site Respiratory Study Network
Before Tracking
- Feasibility “submitted” but often incomplete
- Average completeness: 68%
- Time to contract execution: 39 days
Most commonly missed:
- Patient data source: 52% missing
- Competing studies: 48% missing
- Budget rationale: 44% missing
After Implementation
- Auto-validation in submission form
- Required EHR query results
- Average completeness: 93%
Results:
- Clarifications reduced: 74%
- Time to execution: 23 days
- 41% improvement
Industry Benchmarks
| Completeness Score | Category | Clarification Requests | Downstream Delays |
|---|---|---|---|
| > 90% | Excellent | < 1 per submission | Minimal |
| 80-90% | Good | 1-2 per submission | +5-8 days |
| 70-80% | Fair | 2-4 per submission | +10-15 days |
| < 70% | Poor | 4+ per submission | +20+ days |
Target: Maintain ≥ 92% average completeness score.

Implementation Guide: How to Start Tracking These Metrics Today
Phase 1: Foundation (Weeks 1-2)
Week 1: Define and Document
Day 1-2: Audit Current State
- Review last 10 protocol activations
- Calculate baseline for each of the 5 metrics
- Document current pain points
Day 3-4: Define Measurement Standards
- Standardize how each metric is calculated
- Create data collection templates
- Assign metric owners (who tracks what?)
Day 5: Set Benchmarks
- Define “good/fair/poor” thresholds for your site
- Set realistic improvement targets (don’t aim for perfection immediately)
Week 2: Build Infrastructure
Day 6-8: Configure Tracking System
- If using TrialConnX: Enable metric dashboards
- If using spreadsheets: Create tracking templates
- Set up automated reminders/notifications
Day 9-10: Train Team
- Explain why these metrics matter (not just how to track them)
- Walk through examples
- Address concerns and questions
Phase 2: Pilot (Weeks 3-4)
🚀 Quick Wins to Pursue
- Handoff Latency: Set up Slack/email auto-notifications for stage completions
- Activity Cycle Time: Flag activities stuck in “to-do” or “working” for >3 days
- Feasibility Completeness: Add field validation to forms (prevent <90% submissions)
Phase 3: Optimization (Months 2-3)
Monthly Review Meetings
- Review metric trends
- Celebrate improvements
- Identify root causes of outliers
- Share best practices across team
Process Adjustments
- Re-engineer workflows based on data
- Reduce activity queue times (improve Activity Cycle Time)
- Set up stakeholder SLA tracking (improve Stakeholder Response Time)
- Implement readiness dashboards (boost Pre-Submission Readiness Rate)
Phase 4: Continuous Improvement (Ongoing)
Quarterly Deep Dives:
- Benchmark against past performance
- Compare against industry standards
- Identify new opportunities
- Update targets
Common Mistakes to Avoid
⚠️ Warning: These mistakes can derail your metrics program
Learn from sites that got it wrong so you can get it right the first time.
Mistake #1: Tracking Metrics Without Taking Action
The Problem
Teams collect data but never close the feedback loop. Metrics become “interesting dashboards” instead of decision-making tools.
Impact: Wasted time, team cynicism, no improvements
The Fix
Every metric review meeting must end with 2-3 action items with owners and due dates.
Result: Metrics drive actual process improvements
Mistake #2: Setting Unrealistic Targets Too Early
“We set a 90% IRB first-pass rate target when our baseline was 43%. The team felt defeated. When we reset to ‘60% within 3 months,’ they hit 64%—and morale soared.”
Mistake #3: Blaming Individuals Instead of Fixing Systems
Default mindset: “This is a process problem” until proven otherwise. Ask: “What system/tool/training would prevent this?” Use metrics to identify coaching opportunities, not punitive action.
Mistake #4: Tracking Everything (Metric Overload)
metrics tracked (bad example)
min/week data entry burden
metrics (optimal starting point)
Mistake #5: Not Connecting Metrics to Business Outcomes
💰 ROI Example
One site calculated that each protocol delayed by 30 days cost them $47,000 in lost enrollment fees. When they reduced average delays by 18 days (via these 5 metrics), they saved $282,000 annually. Leadership suddenly became very interested in “boring metrics.”
Frequently Asked Questions
Most sites see measurable improvements within 4-6 weeks of tracking. Quick wins like Handoff Latency can improve in 2-3 weeks with simple process changes (automated notifications, clearer handoff protocols). Metrics like Pre-Submission Readiness Rate may take 2-3 months to show sustained improvement, as they require behavior change and learning.
Typical improvement timeline:
- Weeks 1-2: Establish baselines, set up tracking
- Weeks 3-4: First “aha!” moments as patterns emerge
- Weeks 5-8: Initial process improvements, 10-15% metric gains
- Months 3-6: Sustained improvements, 25-35% metric gains
- 6+ months: Mature process, 40%+ improvements possible
You can absolutely start with spreadsheets. In fact, we recommend it for the first 1-2 months to understand the mechanics before investing in specialized tools.
Spreadsheet approach: Create one tab per metric, manual data entry per protocol, weekly summary calculations. Effort: ~15-20 minutes per week.
Specialized tools (like TrialConnX) become valuable when:
- You’re tracking 10+ concurrent protocols
- You want real-time dashboards
- You need automated alerts (e.g., “Handoff latency exceeded SLA”)
- You want historical trend analysis without manual calculations
Start with Handoff Latency (Metric #1).
Why:
- Easiest to measure: Just track timestamps for stage complete/stage start
- Fastest to improve: Often a notification/workflow fix, not behavior change
- Highest impact: Our analysis shows Handoff Latency accounts for 35-40% of total delays
- Universal application: Applies to every protocol, every site type
Once you’ve mastered Handoff Latency (and seen the benefits), add Feasibility Completeness Score next—it prevents downstream problems before they cascade.
Frame it as “working smarter, not harder.” The key message: These metrics reduce frustration, not add to it.
Strategies that work:
- Show the pain: “We spent 18 hours re-submitting IRB materials last month. What if we could prevent that?”
- Start with voluntary participation: Pick 2-3 enthusiastic team members to pilot metrics on 1-2 protocols.
- Keep it simple: Use the 15-minute test. If tracking takes >15 minutes per week, simplify.
- Celebrate wins publicly: When metrics lead to a faster activation, share the success story.
- Reduce other burdens: If you’re adding metric tracking, consider removing another low-value report or meeting.
Absolutely—in fact, small sites often benefit MORE than large sites.
Why:
- Fewer protocols = easier to track manually
- Small teams = faster process changes (less bureaucracy)
- Tight budgets = higher ROI from efficiency gains
Real example: A 2-person site team tracked just Handoff Latency and Feasibility Completeness. In 3 months, they reduced average activation time from 91 days to 68 days—without adding staff or budget. Their secret: They automated 3 handoff notifications and created a feasibility template with validation.
Fair question—but you still have more control than you think.
For IRB Delays
- Track Pre-Submission Readiness Rate: >90% on-time prep = higher quality submissions
- Use readiness dashboards to ensure all materials are complete before submission
- Engage IRB proactively for early feedback on draft materials
For Sponsor Delays
- Track Stakeholder Response Time: Monitor and escalate when sponsors exceed SLA thresholds
- Provide data-backed follow-ups showing exact days spent waiting
- Set up automated reminders when stakeholders hold the ball >5 days
Mindset shift: Even if external parties cause delays, your response and preparation can minimize the impact. These metrics help you identify where you have leverage.
Industry benchmarking options:
- This Article: Use the benchmark tables provided for each metric as starting points
- Network/CRO Benchmarks: If you’re part of a site network or work with a CRO, ask for anonymized performance benchmarks
- Peer Groups: Join site coordinator communities (SCRS, ACRP) and share anonymized data in working groups
Caveat: Early on, don’t obsess over external benchmarks. Your biggest competitor is your past self. Ask: “Are we improving month over month?” That’s the most important benchmark.
Want to See These Metrics in Action?
TrialConnX automatically tracks all 5 predictive metrics (plus 20+ others) and provides real-time alerts when you’re at risk of delays.
See how TrialConnX helps sites activate protocols faster:
- ✓ Automated handoff latency tracking
- ✓ Activity cycle time monitoring with status transition alerts
- ✓ Stakeholder response time tracking (“currently with” ball visibility)
- ✓ Pre-submission readiness dashboards with on-time activity tracking
- ✓ Built-in feasibility validation (prevents <90% submissions)
No sales pressure—just a quick walkthrough of how leading sites are using data to accelerate study startup.
Sources & Methodology
- Lamberti, M.J., Wilkinson, M., Harper, B., Arcona, S., & Markowski, T. (2018). Assessing Study Start-up Practices, Performance, and Perceptions Among Sponsors and Contract Research Organizations. Therapeutic Innovation & Regulatory Science, 52(5), 572–578. PubMed: 29714558 | DOI
- Veeva Systems. (2020). Study Start-up Pulse Report & Assessing Post-COVID Readiness. Retrieved from Veeva 2020 Study Start-up Pulse Report
- Representative data and case studies based on TrialConnX platform analysis across academic and community sites, 2024-2025
- Industry benchmarks compiled from SCRS (Society for Clinical Research Sites) and ACRP publications
- Cost analysis based on ACRP average hourly rates for study coordinators and legal review
Disclaimer: Case studies and specific metrics represent typical patterns observed across the Clinical Trials domain and are provided for illustrative purposes. Individual site results may vary.