The short version
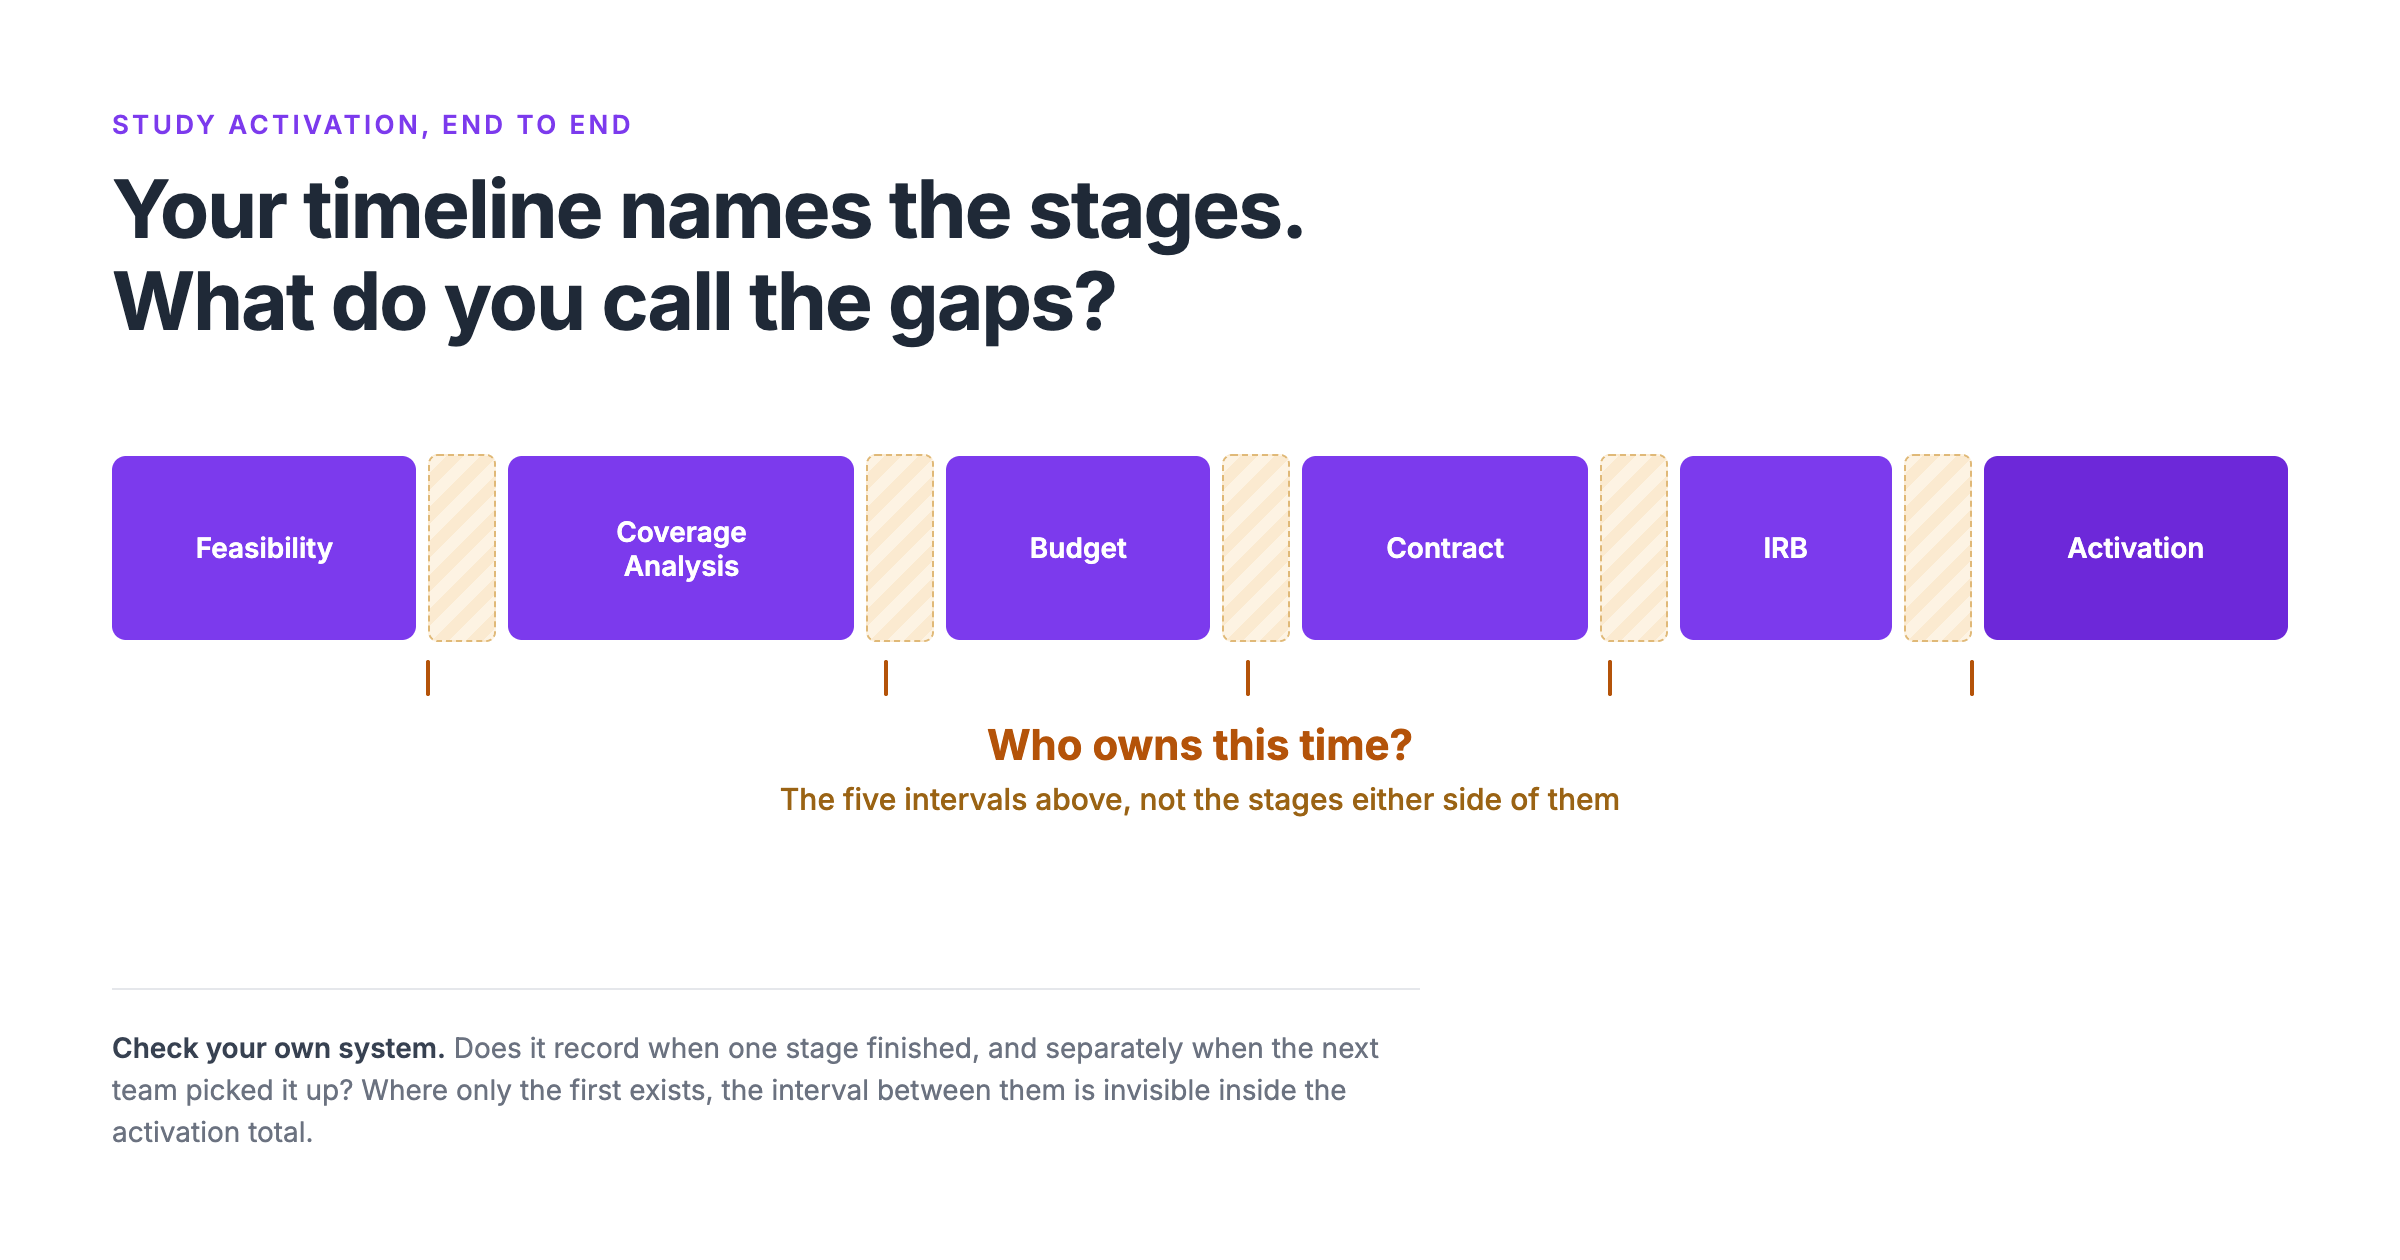
An end-to-end activation report can hide how long studies spend waiting between activities rather than inside them. We call those the handoff gaps: the waiting in the reviews and approvals between one stage and the next. If your system records when a stage finishes but not when the next team picks it up, that interval is invisible inside your activation total. In an exploratory, nonrandomized sample of 308 activations across 13 different investigator-initiated multicenter trials, the panel running all three elements of a connected startup package activated in a median of 133 days, while the panel without the standardized workflow ran to 277. Record two dates at each handoff, when one stage finished and when the next picked it up, reconstructing them for your last 10 activations if the records exist and otherwise capturing them going forward. That first diagnostic slice will show whether those intervals are worth investigating in your own process.
Three startup models, a 144-day spread
You can read a sponsor’s timeline expectations. You can hear at a conference that a site across town opened a study in six weeks. What you cannot do is watch how they did it: which team touched the budget first, who noticed the contract had stalled, whether anyone was tracking the whole path or whether four people each did their part and the order happened to work out.
One published analysis comes close to that comparison. Researchers followed 308 site activations across 13 multicenter trials between 2019 and 2024, all moving through the same coordinating structure, and recorded what startup support each one had (Hillery et al., 2025).
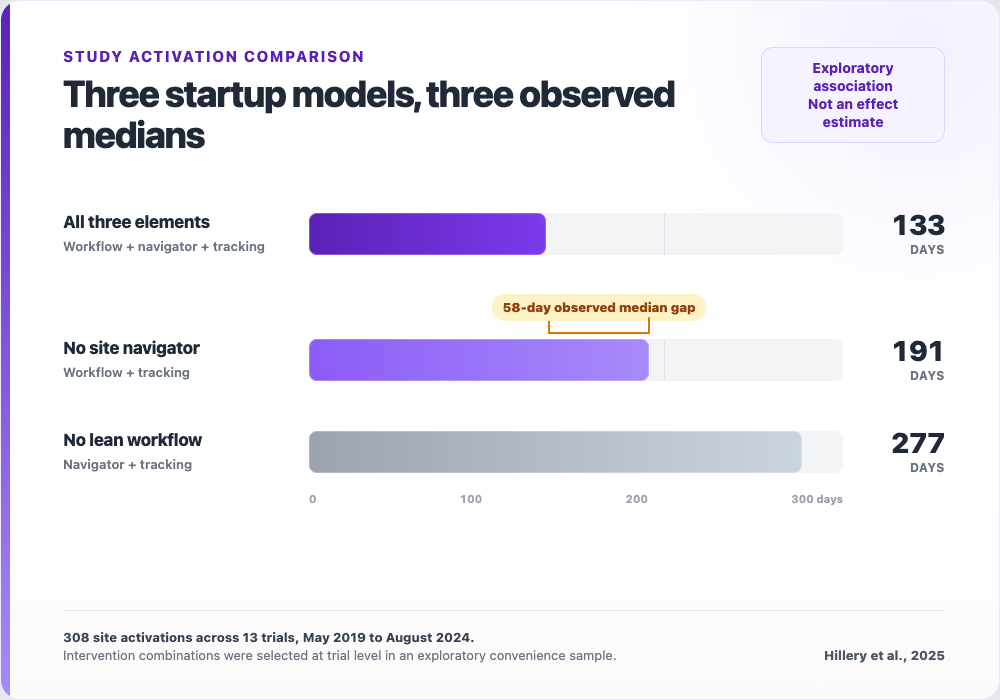
The trials using all three elements activated in a median of 133 days. The trials without the standardized lean workflow ran to a median of 277. Both of the slower panels still had two of the three elements, so this is not a comparison of supported against unsupported.
Before that gap does any work, it needs its limits stated. These were 13 different trials, not randomized arms. The intervention combination was chosen at trial level by trial leadership, and the groups differ in therapeutic area, network, start date and site cohort. Two COVID-19 treatment trials sit in the fastest group. The authors call the work exploratory and list trial design, personnel changes, approvals and technology problems among the things that could move these numbers.
So this is an association between ways of running startup, not proof that one causes the other.
What separated the groups
| Startup model | Median activation | Range of trial medians | Sites |
|---|---|---|---|
| All three ASU elements | 133 days | 56 to 170 | 160 |
| No site navigator | 191 days | 149 to 216 | 52 |
| No lean workflow | 277 days | 198 to 320 | 96 |
Spread between the fastest and slowest startup model
Observed gap between the full package and no navigator
Activated within 90 days, full package against the rest
Medians are of trial medians within each panel, not of individual site activation times. Intervention combinations were selected at trial level in an exploratory convenience sample of 13 trials (Hillery et al., 2025).
The three elements were a standardized workflow with benchmarks set in advance, an electronic tracking system, and dedicated site navigators who checked in with each site weekly.
In the all-three-elements panel, 31% of site activations completed within 90 days. In the other two panels, none did.
The observed median gap between the full package and the no-navigator group was 58 days. Read that as a subtraction and nothing more. Tracking was present in all three groups, so this study cannot tell you what tracking contributed, and the combinations were assigned by trial rather than chosen site by site.
What the result does support is narrower and still useful: running startup as a connected workflow, with someone whose job is to move studies through it, is worth testing at your own site.
The interval between the timestamps
The practical problem sits in what each stage leaves behind.
IRB review has a name, a committee, a submission date and an approval letter. Contract execution has a signature page. Regulatory has a binder. Each of those finishes, and finishing leaves a record.
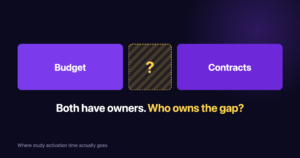
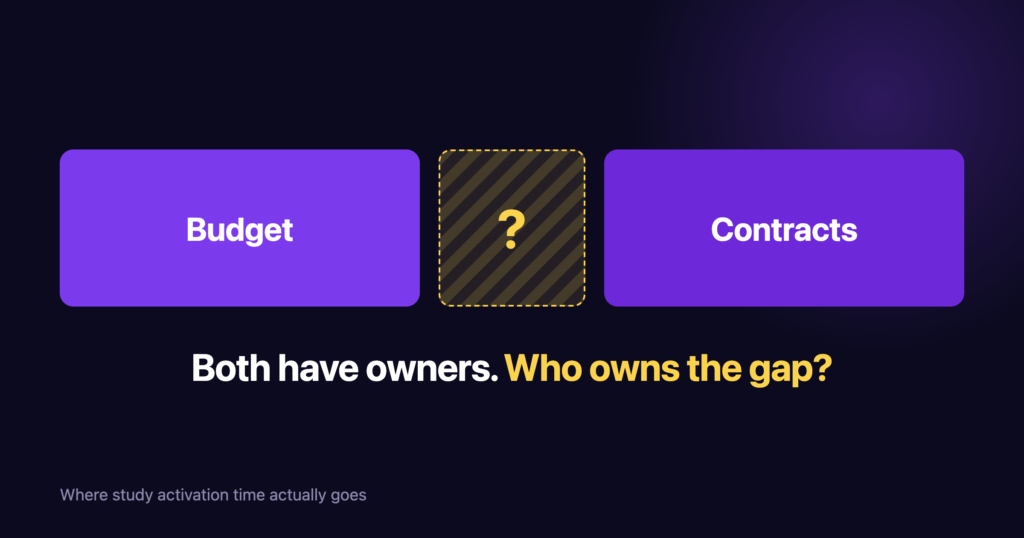
The period where coverage analysis becomes a budget, and the budget becomes a contract, is not one activity. It is several teams’ work overlapping in an order that changes from study to study. Check your own system, whether that is a CTMS or a spreadsheet: does it record when a stage completed, and separately when the next stage picked it up? Where only the first exists, the difference between them cannot be seen at all.
The interval with no record
A stage completing produces a record. A stage being picked up may not. That asymmetry is
why the waiting between teams can be real and large and still not appear anywhere in an
activation report, however carefully that report is built.
If that interval has no name at your site, it is harder to give it an owner. If it has no owner, it is harder to measure. And what is not measured is difficult to improve, however well the individual stages are running.
That chain is a management heuristic rather than a law, but it is cheap to test.
A worked example, hypothetically
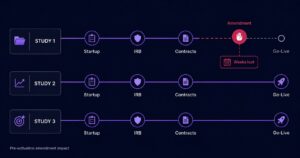
To make the shape concrete, consider a protocol amendment that adds an imaging timepoint. What follows is illustrative rather than observed, and how much of it applies depends on your protocol, billing status and staffing model.
If the imaging changes what can be billed, the coverage analysis has to be revisited. Budget work that depends on that classification may then need reworking, and contract terms that depend on the budget may follow. Depending on the change, regulatory and consent documents may also need updating.
Say each team involved completes its own part in a few days.
The question worth asking is who is tracking the elapsed time across all of them.
If the answer at your site is a recurring meeting, that is worth sitting with. A meeting reports status. Reporting that contracts is waiting on budget does not move the study, and the interval between those two teams belongs to neither of them.
None of this implies anyone is failing. It describes a coordination limit, and coordination limits do not respond to working harder. They tend to get worse as study volume rises.
The chain running underneath it
The handoff gaps are not random. They sit at specific joins, and the joins are where one team’s output has to be good enough for the next team to start.
The joins, rather than the activities on either side of them.
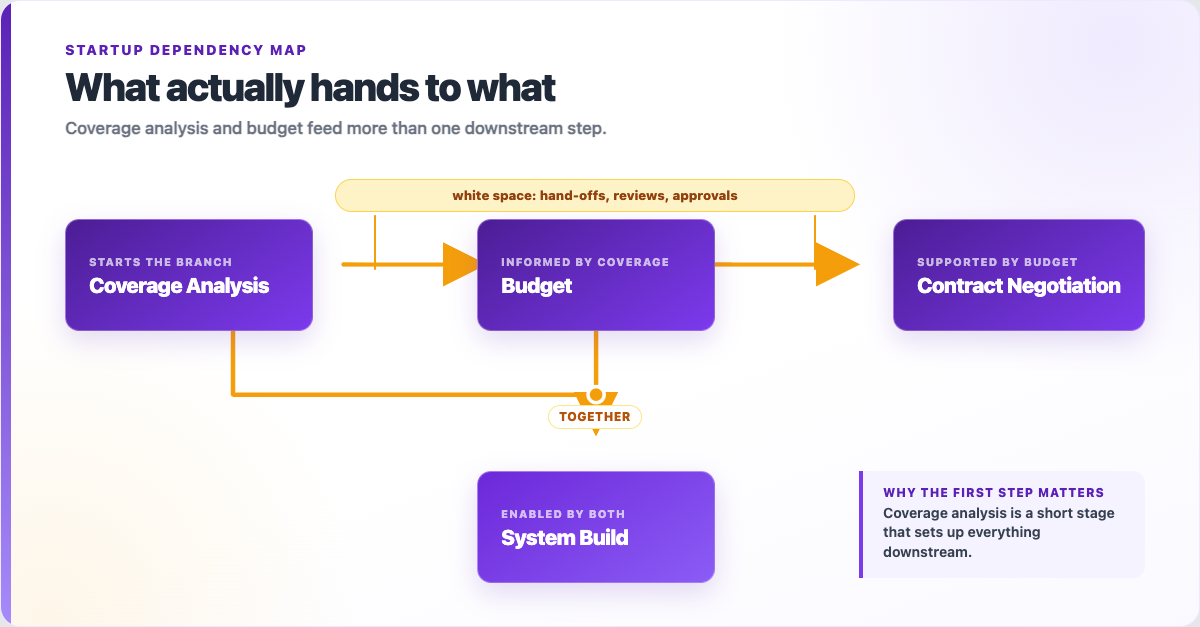
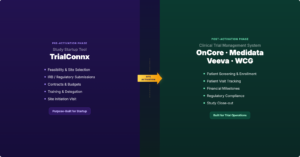
The order runs like this. Medicare coverage analysis informs the budget, because you cannot price what you have not classified. The budget supports contract negotiation. And coverage analysis and budget together enable the trial management system build. Coverage analysis takes a small share of the overall timeline and shapes how smoothly everything after it runs, which is a poor trade if it is the stage your team squeezes when the calendar is tight (WCG, 2026).
Worth saying plainly: not every pause is waste. Many are approvals doing their job. The ones worth examining are the pauses that persist because they always have.
And nothing in the published evidence quantifies these gaps or shows they are the largest component of activation time. The Hillery analysis measured total activation, not handoff latency. That the gaps are where most of the time goes is a hypothesis this article is putting to you, not a finding any source establishes. You can start testing that hypothesis with two dates at each handoff.
The problem is not newly discovered
A team at the University of South Florida mapped their activation process across 78 trials and reported that, contrary to expectation, IRB approval was not the longest step. Contract negotiation and budget negotiation were, at averages of 54.9 and 46.3 days (Martinez et al., 2016). A separate analysis of 689 non-cancer trials at the University of Kansas Medical Center found the stage covering regulatory documents, budget and contract ran to a median of 98 days, against 55 days for IRB review (Cernik et al., 2021).
Both are old, both are single institutions, and the Kansas window closes in 2018, before the single-IRB mandate and before the pandemic changed how sites work. Neither is a benchmark for your site today.
Their value is that they were published, available, and pointing at contracts and budgets more than a decade ago. Startup is still described across the industry as a persistent challenge.
Our reading is that a problem documented this long is not waiting on more evidence.
Not sure where your days are going?
We map activation stage by stage across pre-award, IRB, contracts and go-live, and show you the intervals your report does not separate out.
What some centers have built
Two academic medical centers whose current service pages describe this directly are UCSF and Duke. Both centralize some combination of coverage analysis, budgeting, contracting, system build and startup navigation.
UCSF’s office covers coverage analysis, budget development and negotiation, and protocol calendar build. Duke’s Office of Clinical Research, created in 2012 when the school restructured central research support, provides a broad set of study services.
Their service lists are worth reading against your own process, with one caution: an office existing does not tell you why it was created, and these offices differ from each other. Duke’s current materials include IRB-related review and system support, so this is not a pattern of centralizing everything except IRB.
What is common is that each pulled work which had been distributed across functions into a single place with a single address. The site navigators in the Hillery analysis are a smaller version of the same move, carried by one person rather than a department.
If you cannot fund a central office
Many sites cannot, and pointing at Duke is not useful advice for a site running eight studies with six coordinators.
The transferable part is the ownership rather than the office, and ownership costs less than headcount.
Give the interval a name your team uses out loud. It does not matter what you call it. A thing that can be referred to can appear on an agenda.
Give it one owner rather than a committee. Someone whose explicit responsibility is elapsed time, as distinct from the people responsible for each task. This can be part of an existing role.
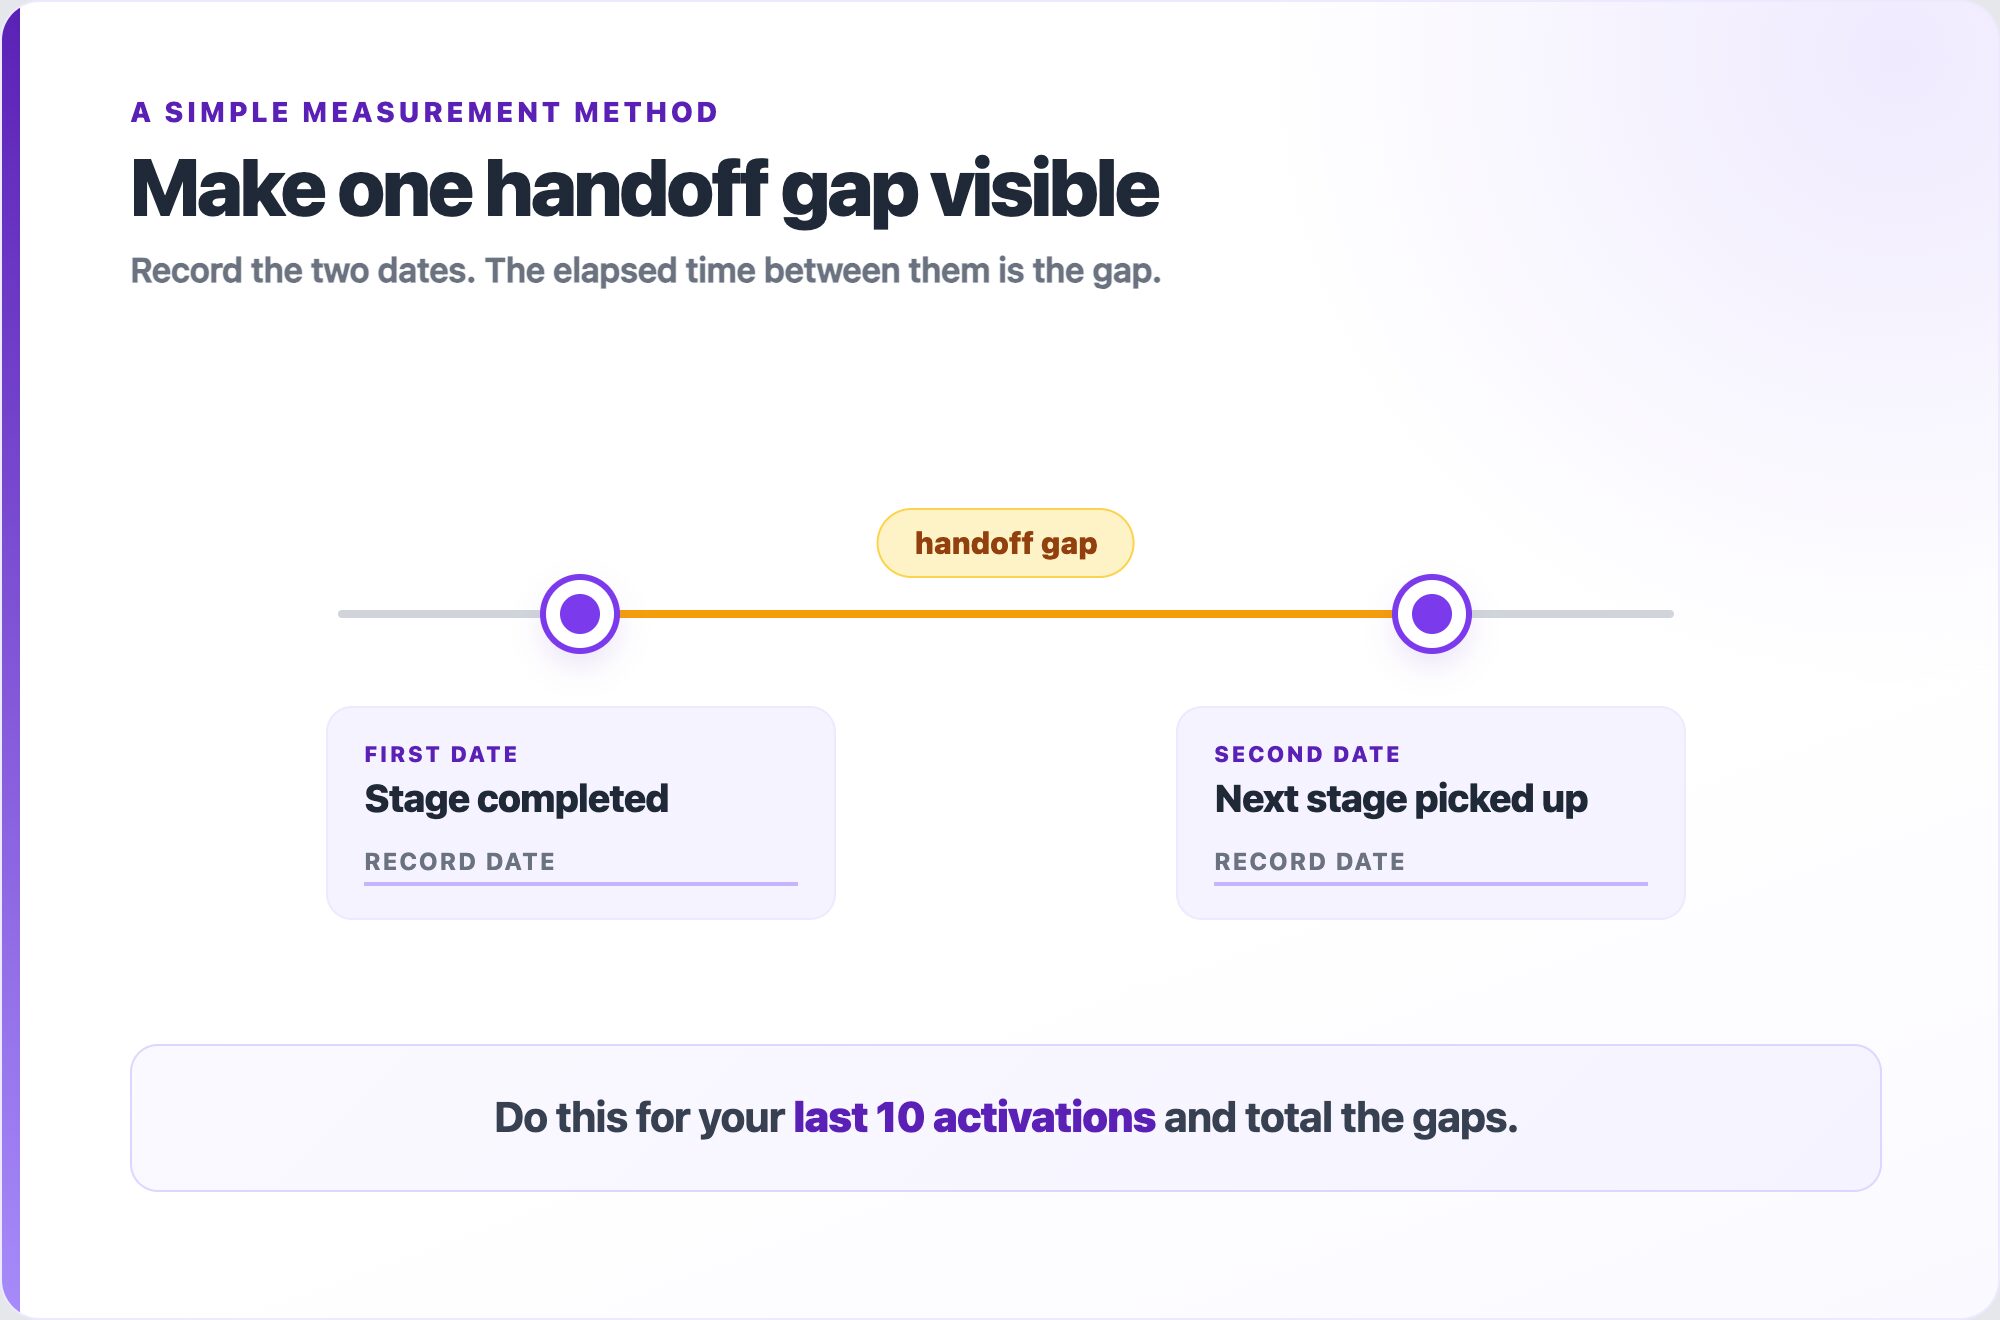
Record two dates at each handoff. When a stage finished, and when the next one picked it up. The second is the one to check for. If both dates exist in your records, 10 recent activations are a useful first diagnostic slice rather than a statistically sound sample, which is the point. If the pickup date was never recorded, use your next 10 instead.
Look for pauses that exist by habit. A review that has never once changed an outcome, or a document that waits for a weekly meeting because it always has. Those cost nothing to remove.
Where policy allows, start dependent work in parallel. Worth checking whether a sequence you treat as fixed is actually required, or just the order things arrived in.
Five questions about your own activation
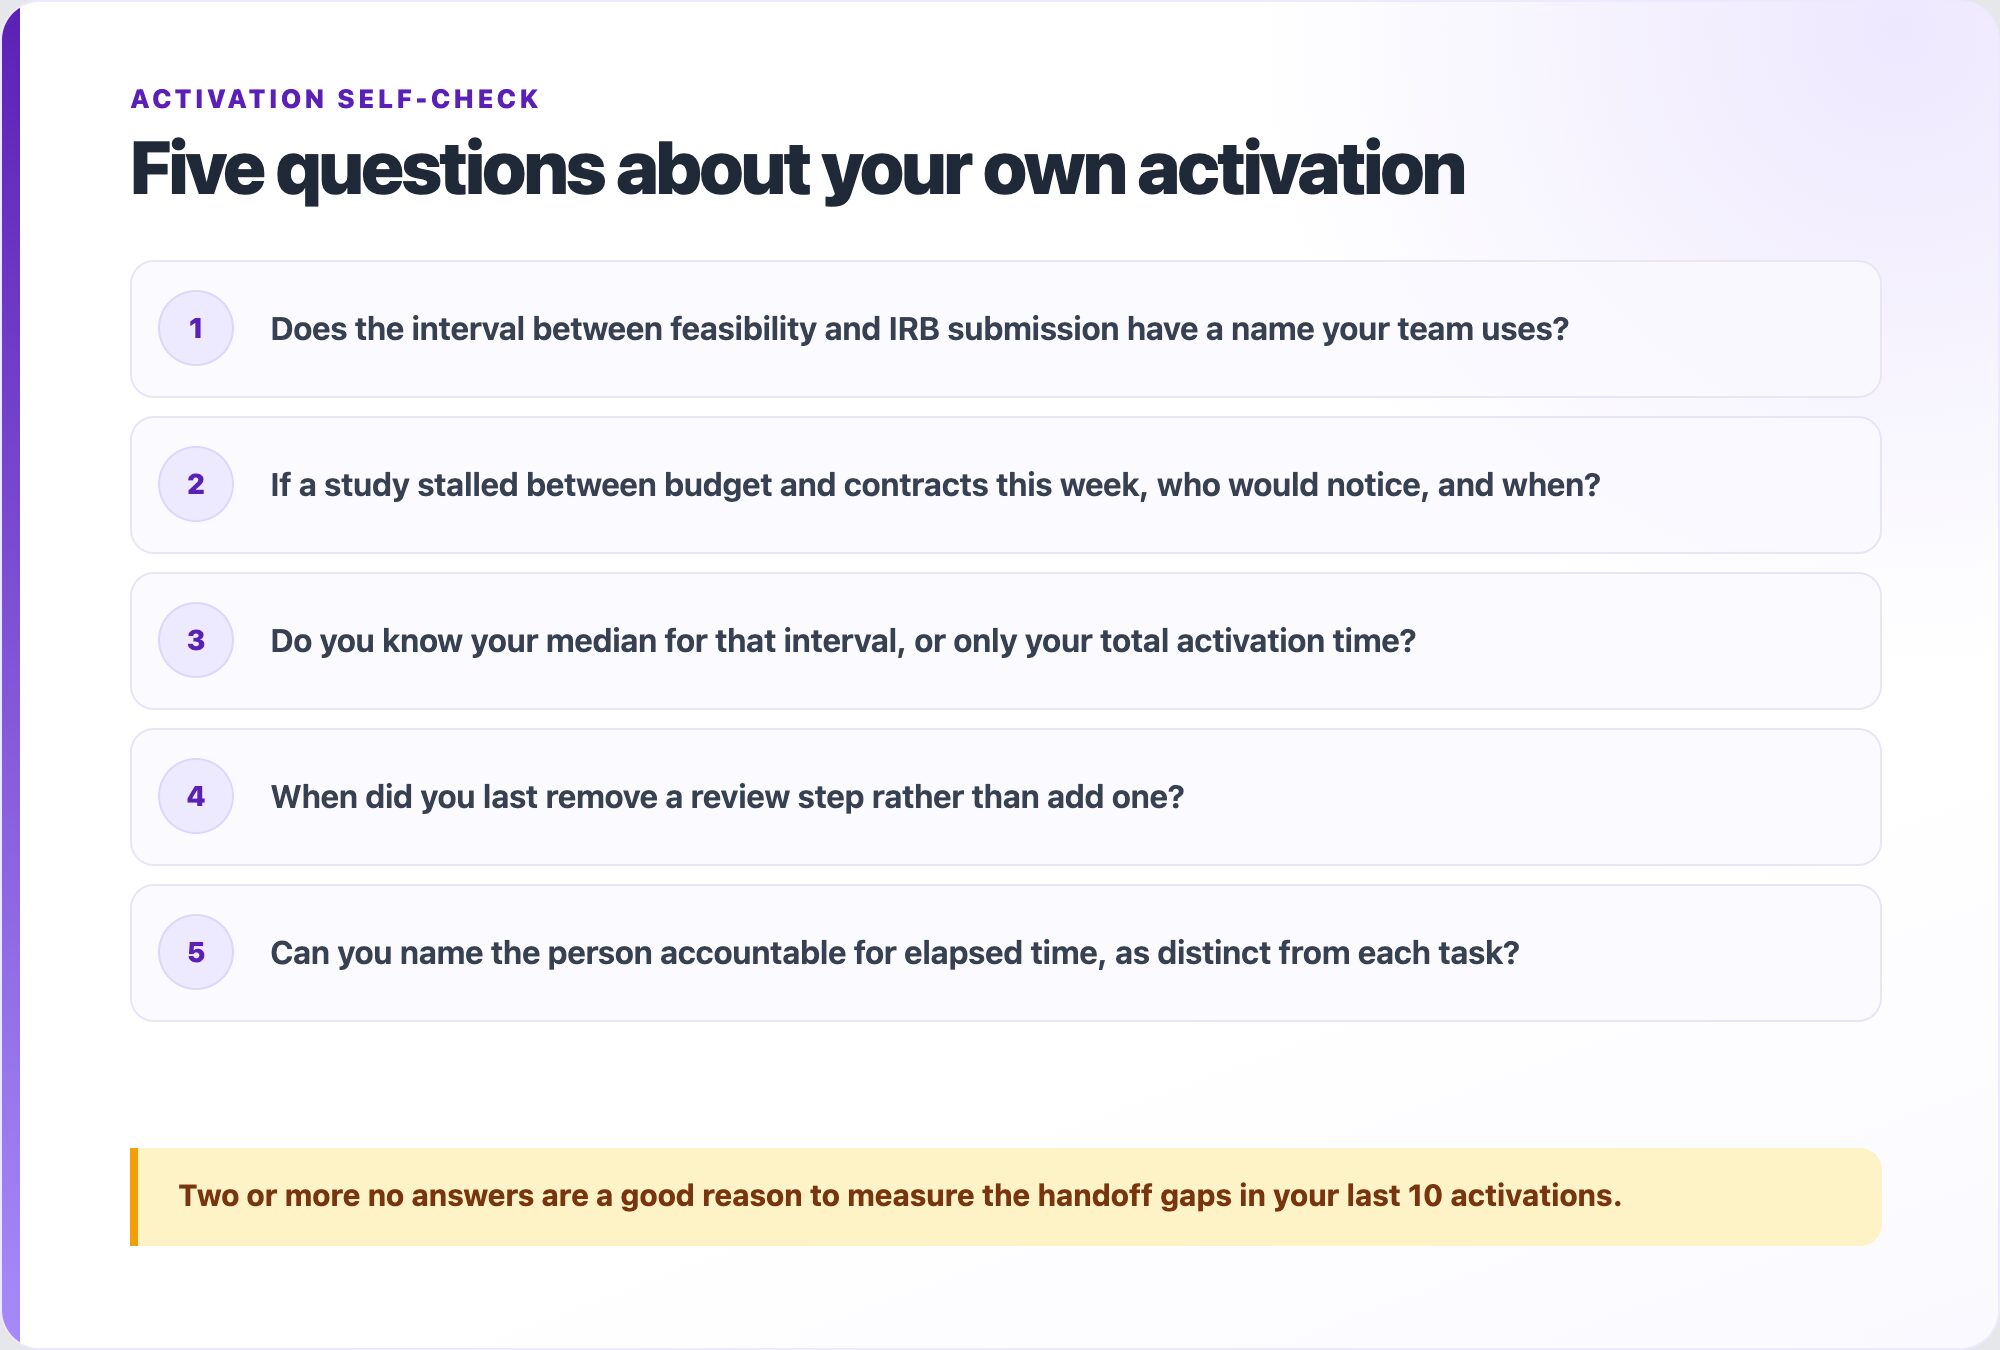
Does the interval between feasibility and IRB submission have a name your team uses?
If a study stalled between budget and contracts this week, who would notice, and when?
Do you know your median for that interval, or only your total activation time?
When did you last remove a review step rather than add one?
Can you name the person accountable for elapsed time, as distinct from each task?
Two or more no answers are a good reason to start measuring handoff gaps.
The takeaway
The evidence does not prove that the gaps are where most activation time goes. What it shows is that trials run as a connected workflow, with someone responsible for moving studies through, finished startup faster in one large exploratory analysis, and that two independent institutions found contracts and budgets rather than IRB at the top of their delay lists more than a decade ago.
Start with two dates
If both dates can be reconstructed from your existing records, audit your last 10 activations: mark the date each stage finished and the date the next one picked it up, then total the gaps. If the pickup date was never recorded, start capturing both dates on your next 10. Either way, that total is not in an activation report that shows only the end-to-end figure.
If you would rather walk through it with us, that is what the 20-minute walkthrough is for. We map where the days are going across pre-award, IRB, contracts and activation.
Sources
- Hillery S, et al. “Accelerating start-up cycles in investigator-initiated multicenter clinical trials.” Journal of Clinical and Translational Science. 2025;9(1):e249. doi:10.1017/cts.2025.10180
- WCG. 2026 Clinical Research Trends and Insights Report. January 2026.
- Martinez DA, et al. “Activating clinical trials: a process improvement approach.” Trials. 2016;17:106. doi:10.1186/s13063-016-1227-2
- Cernik C, et al. “Non-cancer clinical trials start-up metrics at an academic medical center.” Contemporary Clinical Trials Communications. 2021;22:100774. doi:10.1016/j.conctc.2021.100774
- UCSF Office of Clinical Trial Activation; Duke Office of Clinical Research. Institutional service pages.