Part 2 of 3: Study Startup vs. CTMS Series
In Part 1, we explored why your CTMS isn’t built for study startup. This post covers how to recognize when startup has become a bottleneck at your site and what to do about it.
Quick Answer
Study startup becomes a bottleneck when the informal systems that work for one or two studies collapse under the weight of three or more running in parallel. The signs are specific: feasibility responses that used to take 3 days now take 9. IRB submissions that used to pass on the first try now bounce back. Status updates that required a quick hallway check now consume hours of meetings. The fix isn’t working harder. It’s recognizing that startup at scale is a different operational problem than startup for a single study. This post gives you a framework to diagnose where you are and what to do about it.
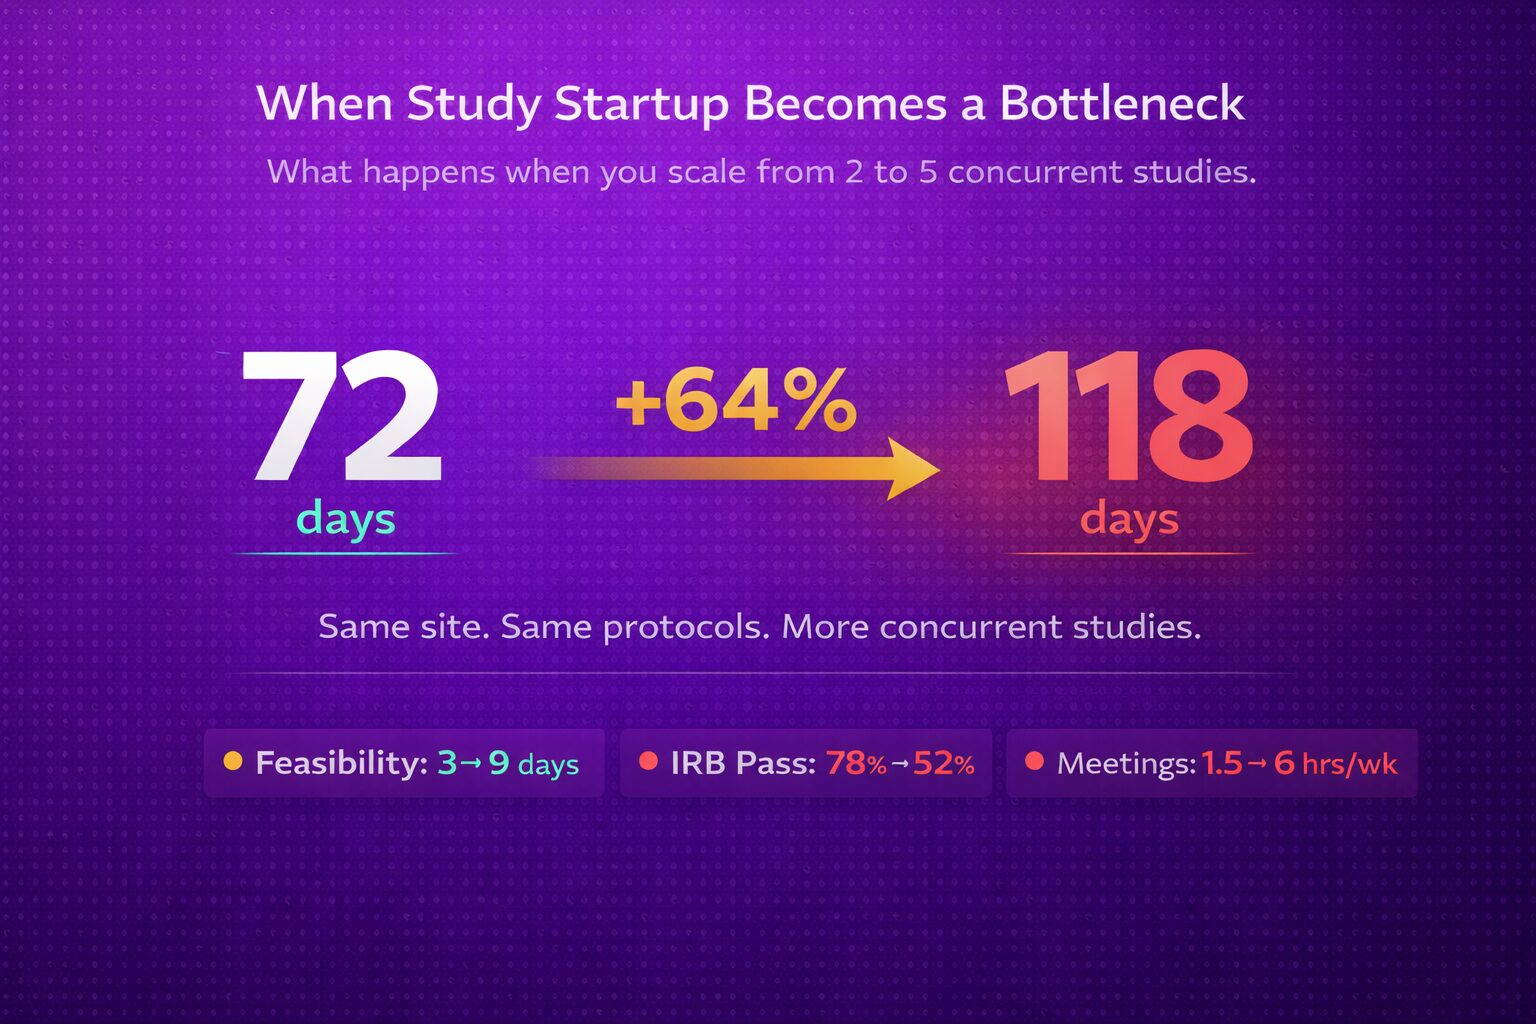
Startup works fine until it doesn’t
One study in startup? You know every task, every deadline, every contact. The protocol requirements live in your head. You track milestones in a spreadsheet, maybe a shared document. It works because one person can hold the entire picture.
Two studies? More effort, but the same approach holds. You adjust your schedule. You stay late occasionally. The spreadsheet gets another tab.
Then a third study arrives. And something subtle changes. The approach that carried you through the first two isn’t holding up. Tasks slip. Handoffs stall. Feasibility responses that took 3 days now take 9. You spend more time chasing updates than doing the work itself.
This isn’t a competence problem. It’s a coordination limit. Sites don’t hit this wall because they’re disorganized. They hit it because informal coordination has a ceiling, and most sites cross it somewhere between study two and study four.
We explored this pattern in detail in Are Spreadsheets Enough for Tracking Study Startup? The short version: the tool isn’t the issue. The coordination model is.
Five signs startup has become a bottleneck at your site
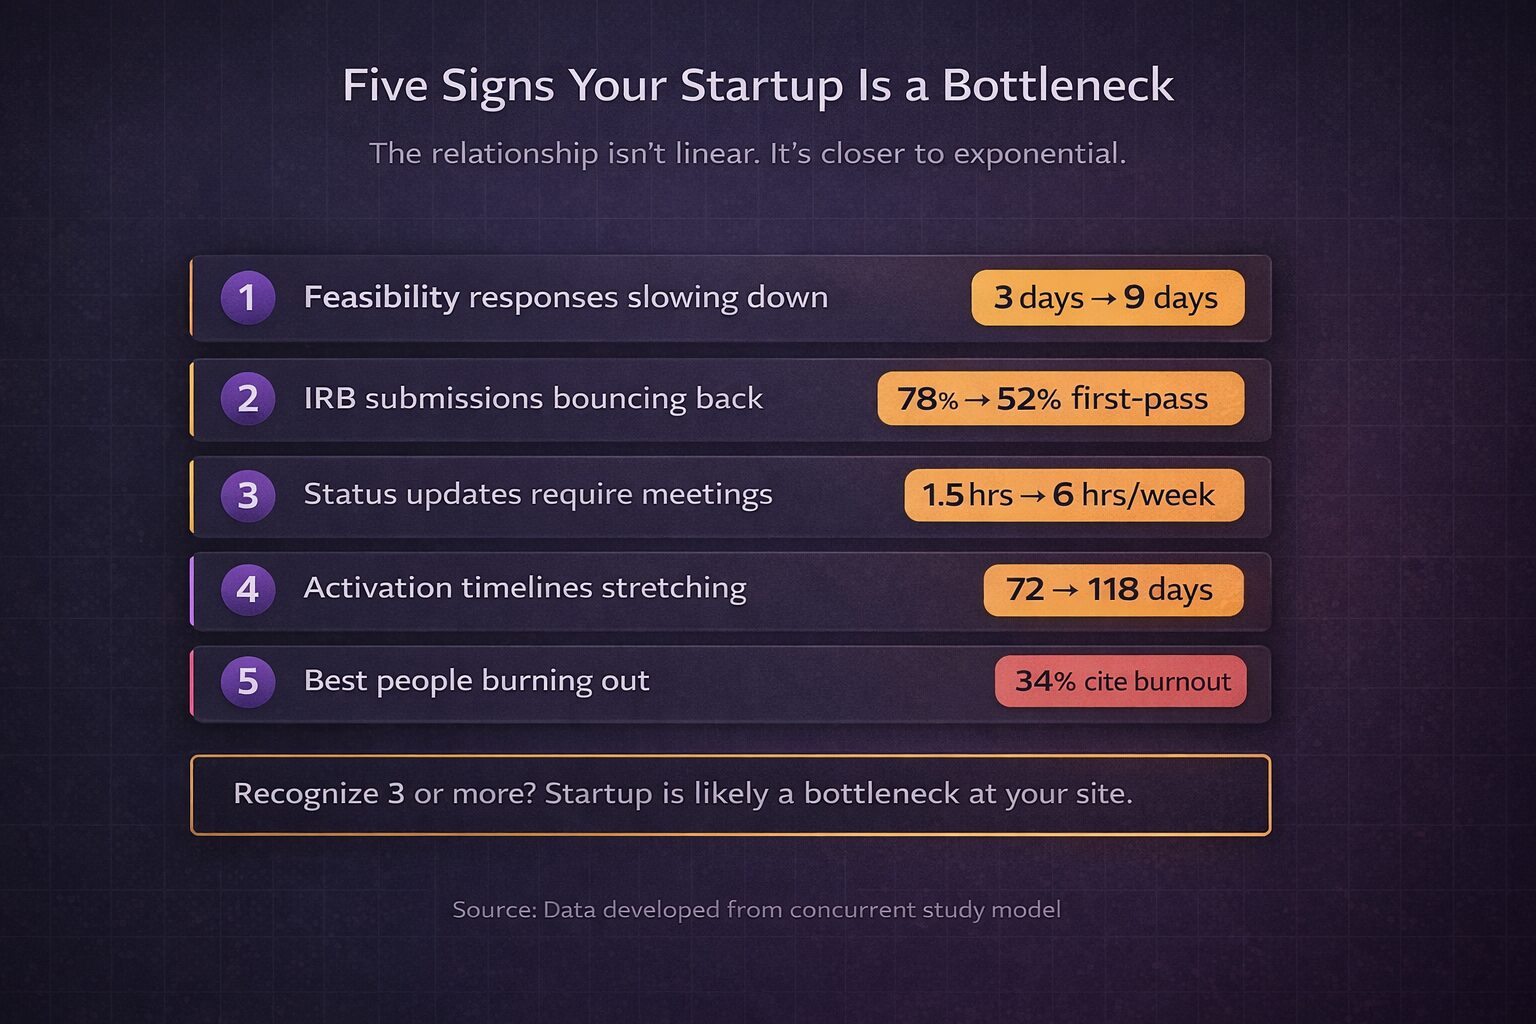
The bottleneck doesn’t announce itself. It builds gradually. At first, it feels like more work. Then it becomes something else. Here are five signs that startup coordination has crossed from manageable to constraining your site.
1. Feasibility responses are slowing down
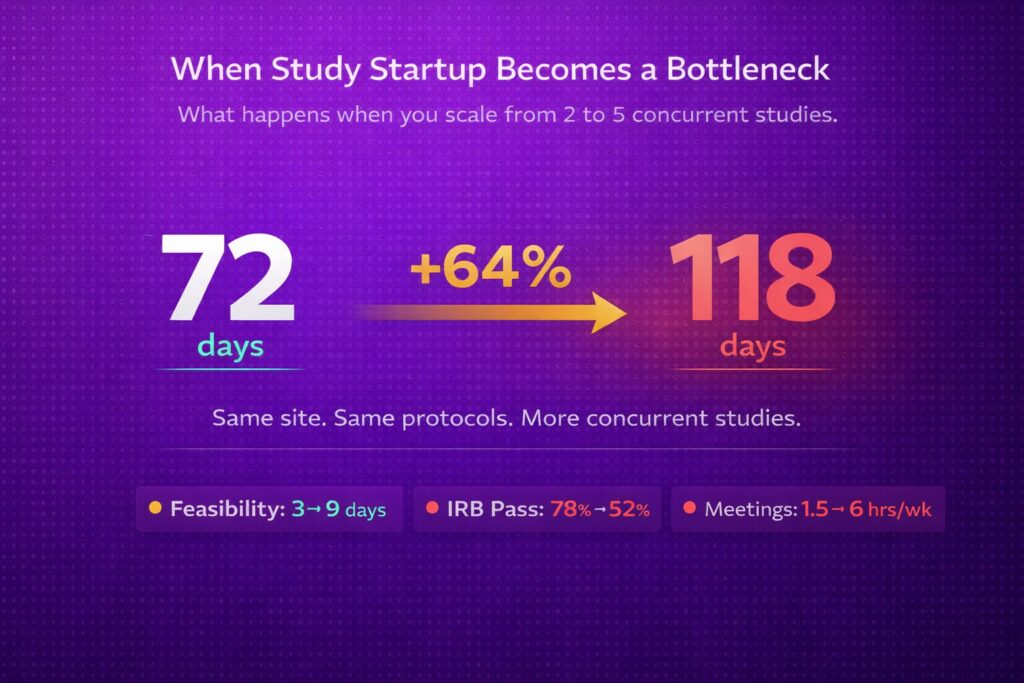
Your feasibility coordinator used to turn responses around in 3 business days. Now, with five concurrent startups pulling attention, responses take 9 days. That’s a 200% increase, and it has nothing to do with the complexity of the questionnaires.
What it looks like at the site: new feasibility requests sit in a queue while the coordinator is buried in active startup work for studies already in the pipeline. They’re triaging instead of responding. Every delayed response is a potential study your site doesn’t get.
2. IRB submissions are bouncing back more often
When a regulatory coordinator has time to prepare a complete submission, first-pass approval rates run around 78%. Under the pressure of multiple concurrent startups, that drops to fifty-two percent. The 26-percentage-point gap adds 13 or more days per study in revision cycles.
What it looks like at the site: the regulatory coordinator knows the package isn’t complete. But three other studies need attention this week, so they submit what they have and hope for the best. The revision comes back. Another cycle begins. We covered the seven most common first-submission failures in Why Site IRB Submissions Fail the First Time.
3. Status updates require meetings instead of glances
At two concurrent studies, status meetings take about 1.5 hours per week. At five concurrent studies, that grows to 6 hours per week. A 300% increase in time spent talking about work instead of doing it.
The meeting isn’t the problem. The problem is that nobody can answer “where is Study X in startup?” without assembling everyone in a room. There’s no single view of what’s happening across studies. So you reconstruct the picture from memory, every week, in a conference room.
What it looks like at the site: Monday becomes meeting day. The actual work gets pushed to Tuesday through Friday. And by Friday, you’re already behind for the next Monday update.
4. Activation timelines are stretching without explanation
One research site went from managing 2 concurrent startups to 5 without changing their coordination process. Their median activation time jumped from 72 days to 118. That’s a 64 percent increase. The protocols weren’t harder. The sponsors weren’t slower. The site hit the complexity ceiling.
What it looks like at the site: every study takes longer than it should, but nobody can point to a single reason. The delays are spread across dozens of small handoffs and micro-decisions that don’t show up in any milestone tracker. We explored this breakdown pattern in What Breaks First When Sites Run Multiple Studies in Parallel.
5. Your best people are burning out
According to the ACRP Workforce Survey (2024), thirty-four percent of CRCs cite burnout as their primary reason for leaving clinical research. When startup workload spills into evenings and weekends, that’s not dedication. It’s a system failure being absorbed by individuals.
What it looks like at the site: the person who holds everything together, the one who remembers which study needs what and when, starts looking for a different job. When they leave, the institutional knowledge leaves with them. And the next study startup takes even longer.
Self-Check
If you recognized yourself in even two of these, you’re likely already losing time you haven’t measured. The rest of this post covers why that happens and what you can do about it.
Why working harder doesn’t fix a scaling problem
This is where most sites start to feel the shift. The natural response when things slow down is to push harder. Work longer hours. Skip a review step. Ask the coordinator to take on one more study. Maybe hire another person.
But the bottleneck isn’t a staffing problem. It’s an architecture problem.
Study startup involves parallel workstreams: regulatory submissions, contract negotiations, budget creation, feasibility responses. Each study adds a full set. At one study, you’re managing 4 workstreams. At five studies, you’re managing 20, with overlapping dependencies, shared resources, and handoffs that multiply faster than headcount ever could.
| Concurrent Studies | Active Workstreams | Handoff Points/Week | Coordination Hours/Week |
|---|---|---|---|
| 1 | 4 | ~5 | ~1 hr |
| 2 | 8 | ~12 | ~1.5 hrs |
| 3 | 12 | ~22 | ~3 hrs |
| 5 | 20 | ~40 | ~6 hrs |
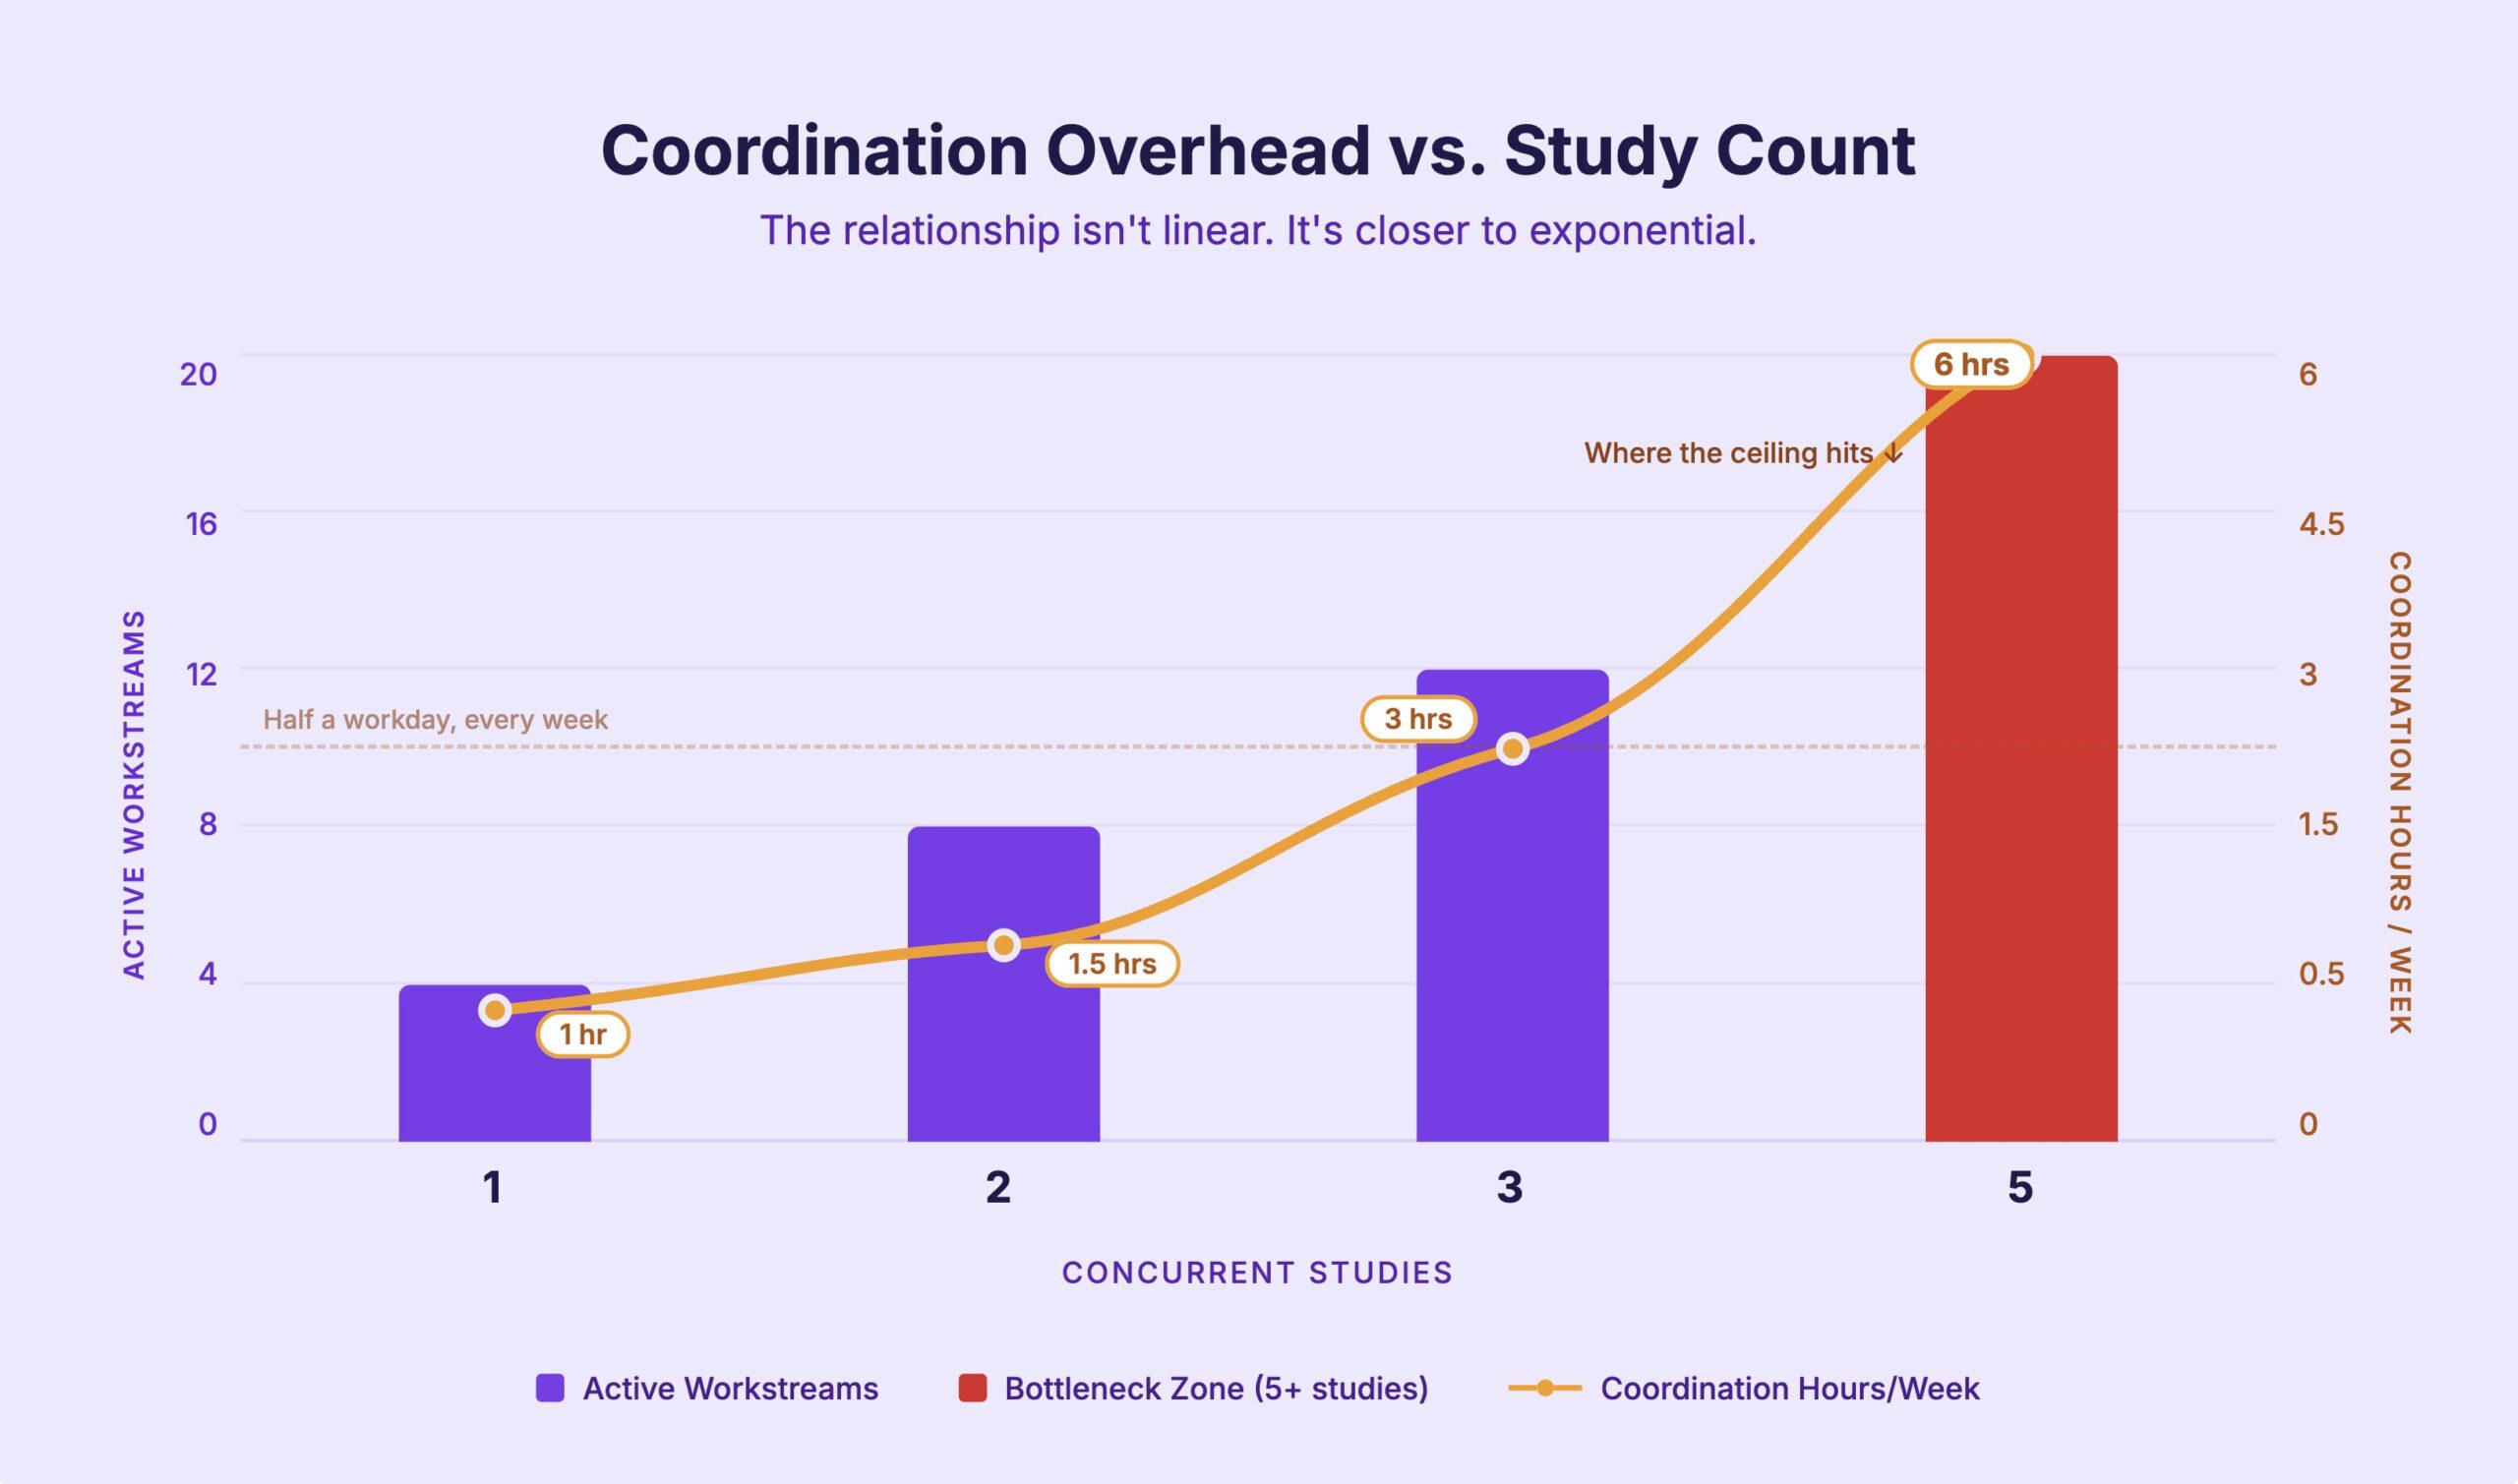
The relationship between study count and coordination overhead isn’t linear. It’s closer to exponential. That’s what makes this a scaling problem, not a people problem. How do you track 20 parallel workstreams across spreadsheets, email threads, and shared drives? You don’t. Not well.
For a closer look at where this administrative burden lands, see The Hidden Admin Workload in Study Startup.
Pro Tip: If doubling your team wouldn’t fix the slowdown, it’s not a staffing problem. It’s a coordination architecture problem. Adding people to a broken process makes it faster and more broken.
The hidden cost of a slow startup
And this is the part that’s easy to miss. A startup bottleneck isn’t an inconvenience. It has real downstream consequences for study quality, site revenue, and staff retention. The costs compound, and most don’t surface until it’s too late to prevent them.
Study quality takes the first hit
According to the ACRP Quality Benchmarking Survey (2023), 67% of protocol deviations in the first 90 days trace back to inadequate startup preparation. Rushed startup means incomplete training, unclear delegation logs, and staff who don’t fully understand the protocol before the first patient walks in.
One site managing 8 studies on compressed timelines saw a 23% protocol deviation rate. After implementing structured startup management with clear stage gates and handoff ownership, deviations dropped to 9%. A sixty-one percent reduction.
Of protocol deviations trace to inadequate startup preparation
Reduction in deviations after structured startup management
Source: ACRP Quality Benchmarking Survey (2023)
Site revenue erodes
Every delayed feasibility response is a potential study your site doesn’t get. Every extended activation timeline is sponsor confidence you’re losing. Sites competing for studies are judged on activation speed. A site that consistently takes 118 days when the industry median is 89 is a site that stops getting selected.
This isn’t abstract. If your feasibility response time has gone from 3 days to 9, sponsors are seeing that. They’re comparing your turnaround against other sites. And they’re making selection decisions based on it.
Staff retention breaks down
One site saw 28% annualized staff turnover before implementing a structured startup approach. After giving coordinators visibility into workload distribution, clear handoff ownership, and proactive escalation paths, turnover dropped to eleven percent. A 61% reduction.
Coordinators don’t leave because the work is hard. They leave because the work feels impossible and nobody can see what they’re carrying. When a coordinator quits, the institutional knowledge leaves with them, and the next startup takes even longer.
We explored this cycle in depth in The Unspoken Tradeoffs Sites Make to Hit Startup Timelines.
What to do about it: a practical framework for sites
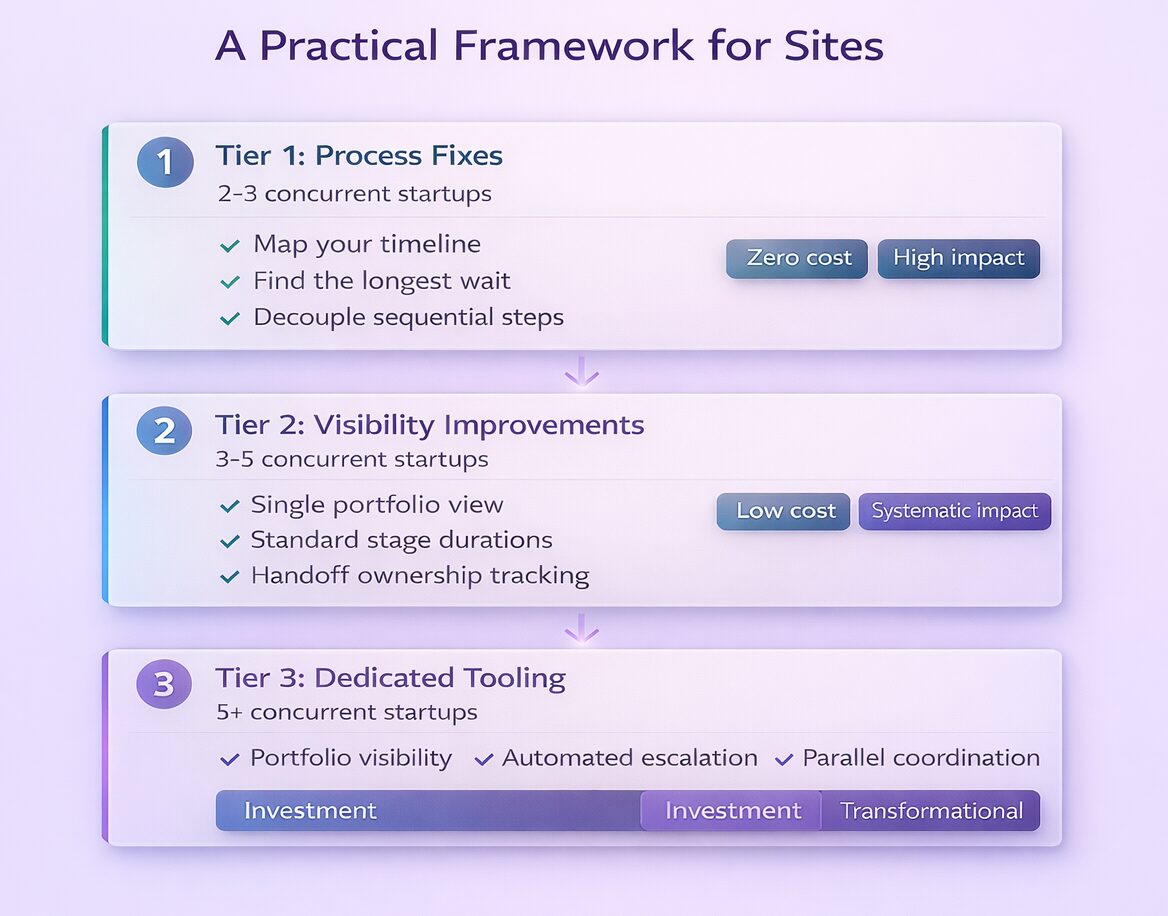
Not every site needs the same intervention. The right response depends on where you are: how many concurrent startups you manage, how much visibility you have, and how fast you need to scale. Here’s a three-tier framework matched to your situation.
Tier 1: Process fixes (zero cost, high impact)
Best for: Sites running 2-3 concurrent startups
Start by mapping the startup timeline for your last 3 studies. Not the total days. Break it into stages and measure two things: time in each stage and time between stages. The gaps between stages are where handoff problems hide.
At one academic medical center, the longest single wait was getting in front of the PI: 29 business days. They didn’t need software to fix that. They restructured when the resource meeting happened and eliminated the wait.
Another quick win: decouple sequential steps. Can budget shell creation start before all sponsor information arrives? In most cases, yes. Starting the shell earlier means the budget is closer to ready when the final details come in, instead of starting from zero on Day 72 of a 120-day target.
For guidance on breaking down your startup timeline, see Inside the Study Start-up Timeline.
Tier 2: Visibility improvements (low cost, systematic impact)
Best for: Sites running 3-5 concurrent startups
Process fixes tell you where the problems are. Visibility improvements keep them from coming back. Three things to build:
Where every study stands across regulatory, contracts, budgets, and feasibility. One view, all studies. Not a spreadsheet per study.
So you can spot outliers before they become delays. If IRB review normally takes 14 days and Study X is at day 23, that’s a flag.
Not “contract is in progress” but “contract is waiting on [person] since [date].” The name and the date change the conversation.
For a practical starting point, see The Minimal Viable Study Startup Dashboard.
Tier 3: Dedicated startup tooling (investment, transformational impact)
Best for: Sites running 5+ concurrent startups, or planning to grow
At this volume, the coordination complexity exceeds what any spreadsheet or dashboard can handle. Dedicated startup tooling provides:
See every active startup across all studies in one system. No more reconstructing the picture from five spreadsheets and a dozen email threads.
Tasks that exceed expected durations trigger alerts before they become delays. Staff have a safety net for flagging upstream blockers instead of absorbing them.
Run regulatory, contracting, and budget work in parallel across multiple studies without depending on one person to hold it all together.
Time in stage, time between stages, handoff duration, first-pass rates. Data that tells you what to fix, not only that something is slow.
Not every site needs Tier 3 on day one. But every site running 3 or more concurrent studies should at least be operating at Tier 1. Most aren’t.
| Your Situation | Start Here | Goal |
|---|---|---|
| 1-2 studies, startup feels manageable | Tier 1: Map your timeline | Find the hidden gaps before they compound |
| 3-4 studies, startup is stretching | Tier 2: Build visibility | Coordinate by data, not by meeting |
| 5+ studies, startup is the constraint | Tier 3: Dedicated tooling | Manage a portfolio, not a pile of spreadsheets |
What happens when you fix the bottleneck
One academic medical center and NCI-designated cancer center was managing startup across two departments with all ancillary teams. Their activation target: 120 business days. They knew startup felt slow — they didn’t know where the time was going.
What the Data Revealed
When they mapped their first three studies, three things became clear:
- Lab manuals from sponsors weren’t arriving for 3 or more months into the activation process. This delay was invisible in their previous workflow.
- Budget work couldn’t start until Day 72 of a 120-day target. That left 48 days for core work that should have had the full timeline.
- Staff believed they were keeping up. The data showed that in some cases, they were the barrier, without knowing it.
“We weren’t able to start our budget until Day 72 and we are charged with opening within 120 business days.”
Central Office Leadership
What They Changed
Two targeted fixes. Not a complete overhaul.
- Moved budget shell creation earlier in the process, decoupling it from waiting for complete sponsor information
- Restructured resource meeting timing to eliminate a 29-day wait to get in front of the PI
Results Within 30 Days
Saved per study
Faster activation
Process changes made
“The most important thing for your institution right now is to analyze bottlenecks — are they realistic timelines, has something changed in the process, is there a training issue… The timelines will start decreasing now that we have visibility on tasks.”
Central Office Leadership
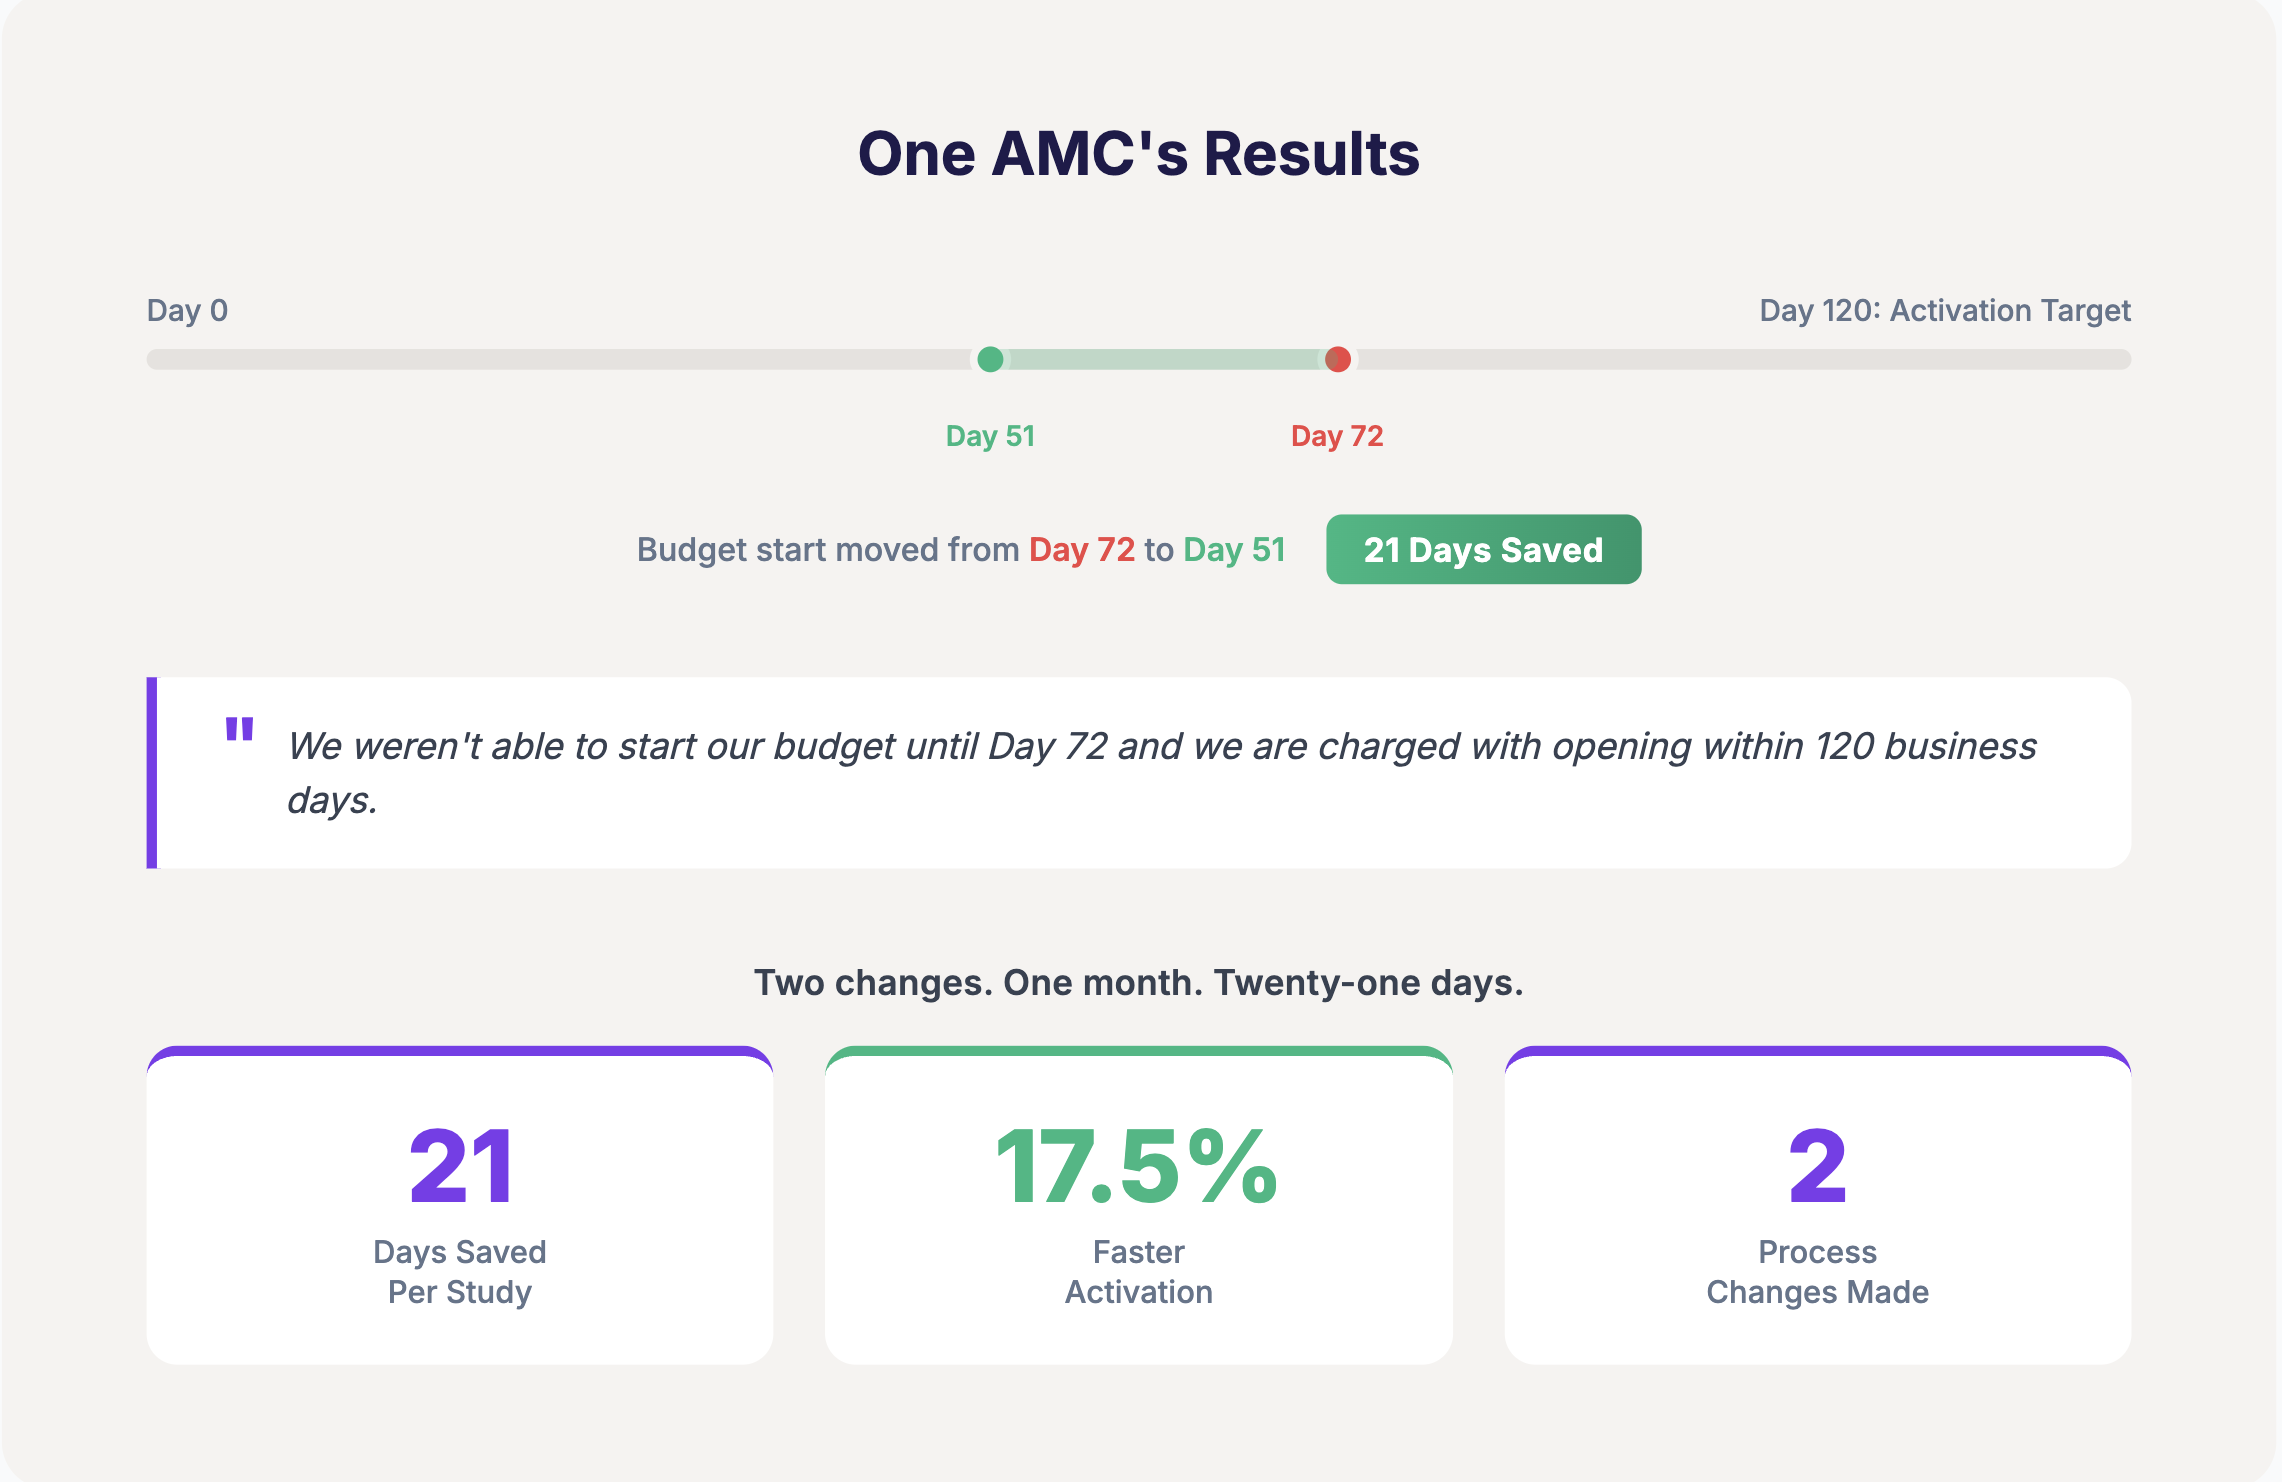
Two process changes. One month. Twenty-one days saved per study. They didn’t overhaul everything. They saw where the time was going and fixed the two biggest gaps. That’s the power of visibility over effort.
For a broader look at moving from manual tracking to structured systems, see From Spreadsheets to Systems.
Where does your site stand?
Before you decide what to do next, assess where you are right now. Five questions. Be honest.
For specific metrics to track and what they reveal, see 5 Study Startup Metrics That Actually Predict Delays.
See which stage is adding the most days to your activation timeline.
Frequently Asked Questions
How many concurrent studies before startup becomes a bottleneck?
Most sites hit the complexity ceiling between 3 and 5 concurrent startups. The exact number depends on your team size, process maturity, and how much institutional knowledge lives in one person’s head. If you’re tracking startup across spreadsheets and email, the ceiling comes sooner. The coordination overhead grows faster than the study count, which is why adding one more study can feel like adding three.
What’s the biggest sign that startup is a bottleneck?
When activation timelines stretch without a clear reason. If the protocols aren’t harder and the sponsors aren’t slower, but every study takes longer than it should, the bottleneck is in your internal coordination. Another reliable sign: you can’t answer “where is Study X?” without calling a meeting or checking multiple sources.
Can process changes alone fix a startup bottleneck?
For sites running 2-3 concurrent studies, yes, often significantly. One academic medical center saved 21 days per study with just two process changes: moving budget shell creation earlier and restructuring resource meeting timing. But process changes require visibility into where time is being lost, which becomes harder to achieve manually as study volume grows.
What’s the difference between a staffing problem and a scaling problem?
A staffing problem means you don’t have enough people to do the work. A scaling problem means the coordination model itself doesn’t work at higher volume. Adding people doesn’t fix it because the overhead grows faster than the headcount. A practical test: if you doubled your team and startup would still feel slow, it’s a scaling problem. The fix is structural, not incremental.
What should I do first if startup is already a bottleneck?
Map the startup timeline for your last 3 studies. Measure time in each stage and time between stages. The gaps between stages, where work sits waiting for a handoff, are almost always where the biggest delays hide. You can’t fix what you can’t see. Once you have the data, it will point directly to the one or two changes that will have the biggest impact.
Start with the data
Pull the timelines for your last three study startups. Not the total days. Break them into stages. How long did each stage take? How long did work sit between stages waiting for someone to pick it up?
That gap between stages is where your bottleneck lives. You can’t fix what you can’t see.
So start there. Map three studies. Find the gap. Then fix it.
Study Startup vs. CTMS Series
Part 1: Why Your CTMS Isn’t Built for Study Startup
Part 2: When Study Startup Becomes a Bottleneck (You are here)
Part 3 (coming soon): How Specialized Study Startup Tools Work Alongside OnCore, Medidata, and Veeva
Ready to Find Your Bottleneck?
See where your startup time goes. Get the visibility to make targeted changes that cut weeks from your activation timelines.
Sources
- Tufts Center for the Study of Drug Development (2024). Study startup cycle time benchmarks.
- ACRP Quality Benchmarking Survey (2023). Protocol deviation root cause analysis.
- ACRP Workforce Survey (2024). Clinical research coordinator retention and burnout data.