Quick Answer
Study startup performance often collapses when sites move from managing one or two trials to a larger portfolio. This happens because of the Coordination Tax – the administrative friction and context-switching overhead that grows exponentially as you add studies. According to Tufts CSDD (2024), the median study startup cycle is 89 days, but sites running 3+ concurrent startups often exceed 110 days. While a single study can be managed with a spreadsheet, a portfolio of three or more studies introduces significant “handoff latency.” Site teams spend more time searching for status updates than executing startup tasks. To scale, sites must shift from individual study trackers to a centralized portfolio visibility system that standardizes milestones and eliminates manual status checking.
Why does study startup feel slow when running multiple studies in parallel?
You probably feel like your team is working harder than ever, yet studies are taking longer to activate.
This isn’t a “hustle” problem. It’s a secondary complexity problem. When you run one study, your mental map of the tasks is clear. When you run two, it’s a juggle. By study three, the mental map breaks. We previously analyzed how startup time is actually spent, and the findings show that idle time is the biggest killer.
The “slowness” you feel is the time lost between active work. It’s the three days a contract sits on a desk because the regulatory coordinator was buried in an IRB submission for a different trial. In a manual environment, every new study adds a layer of coordination. Eventually, this outweighs the study-advancing work itself.
The math is simple but painful. One study requires tracking maybe 15 active tasks at any given time. Two studies means 30 tasks with potential conflicts. Three studies means 45 tasks, plus the overhead of remembering which sponsor prefers email versus portal submissions, which IRB has the faster turnaround, and which contract template you’re using for each.
Pro Tip: Track “time in stage” separately from “time between stages.” The latter reveals handoff problems that the former masks.
What is the “Coordination Tax” and why does it hit at study #3?
The Coordination Tax is the total time your team spends on administrative overhead that doesn’t directly advance a study toward activation. This includes status meetings, searching for emails, updating spreadsheets, and asking colleagues “where are we on this?”
Coordination Tax: The cumulative hours spent on activities that don’t directly advance a study toward activation but are required to maintain awareness across multiple concurrent projects.
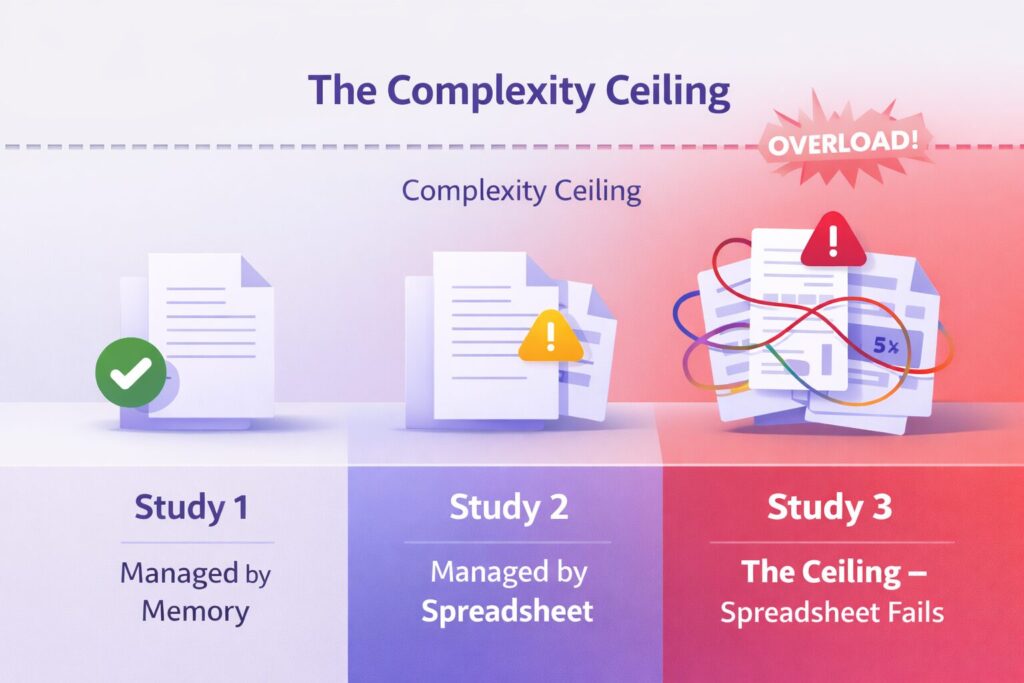
In our analysis of site workflows, aligned with ACRP research on study coordinator workload distribution, we found that study #3 is the “Complexity Ceiling.”
Study — Managed by memory
Studies — Managed by spreadsheet
Studies — The spreadsheet fails
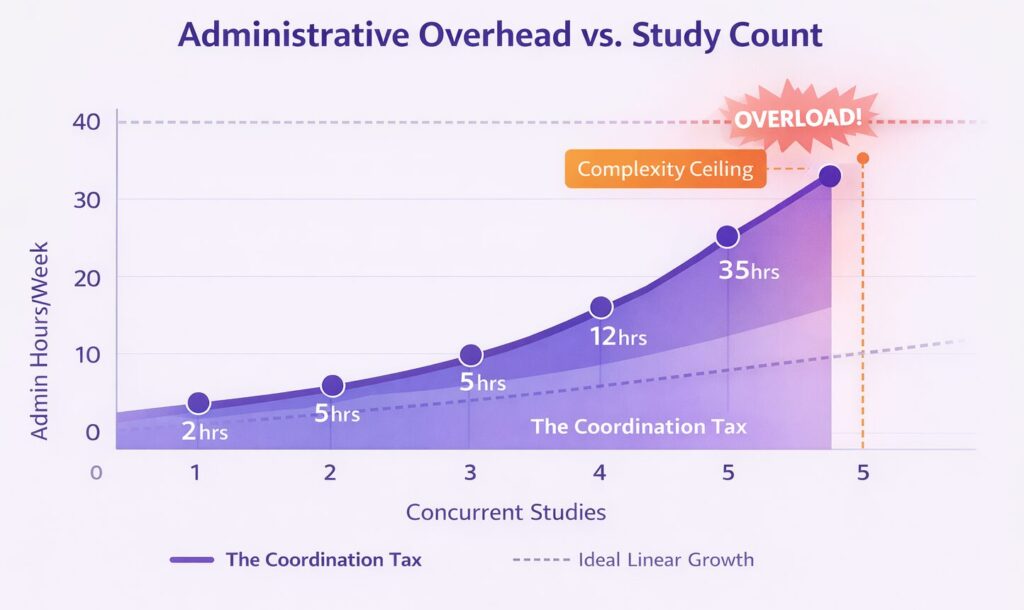
At this stage, the human brain can no longer track the multi-dimensional dependencies of three different sponsors and three different IRBs. You stop managing the studies and start managing the trackers. This is why we argue that spreadsheets are rarely enough for high-growth research teams.
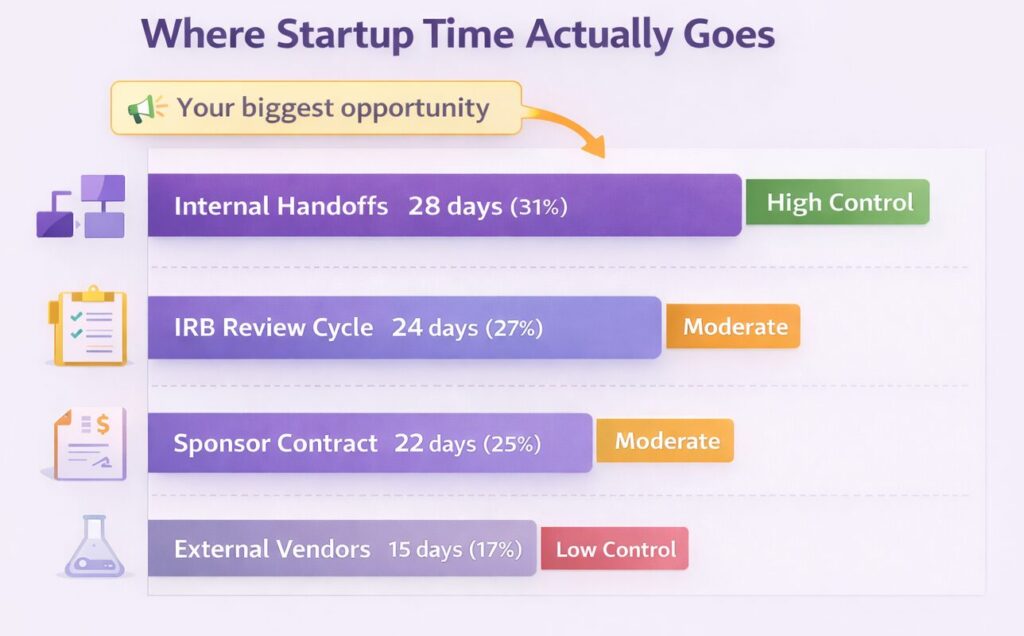
Where Startup Time Actually Goes: Industry Breakdown
Understanding where delays originate helps you focus improvement efforts on what you can control.
| Source | Typical Days | % of Total | Controllable? |
|---|---|---|---|
| Internal handoffs | 25-30 | 28-34% | ✅ High |
| IRB review cycle | 20-28 | 22-31% | ⚠️ Moderate |
| Sponsor contract negotiations | 18-25 | 20-28% | ⚠️ Moderate |
| External vendors (labs, equipment) | 12-18 | 13-20% | ❌ Low |
Source: Aggregated from Tufts CSDD (2023) and industry benchmarks
Key Takeaway: Internal handoffs, the one area entirely within your control, account for nearly a third of total startup time. This is where process improvement delivers the fastest ROI.
What are the warning signs you’ve hit the complexity ceiling?
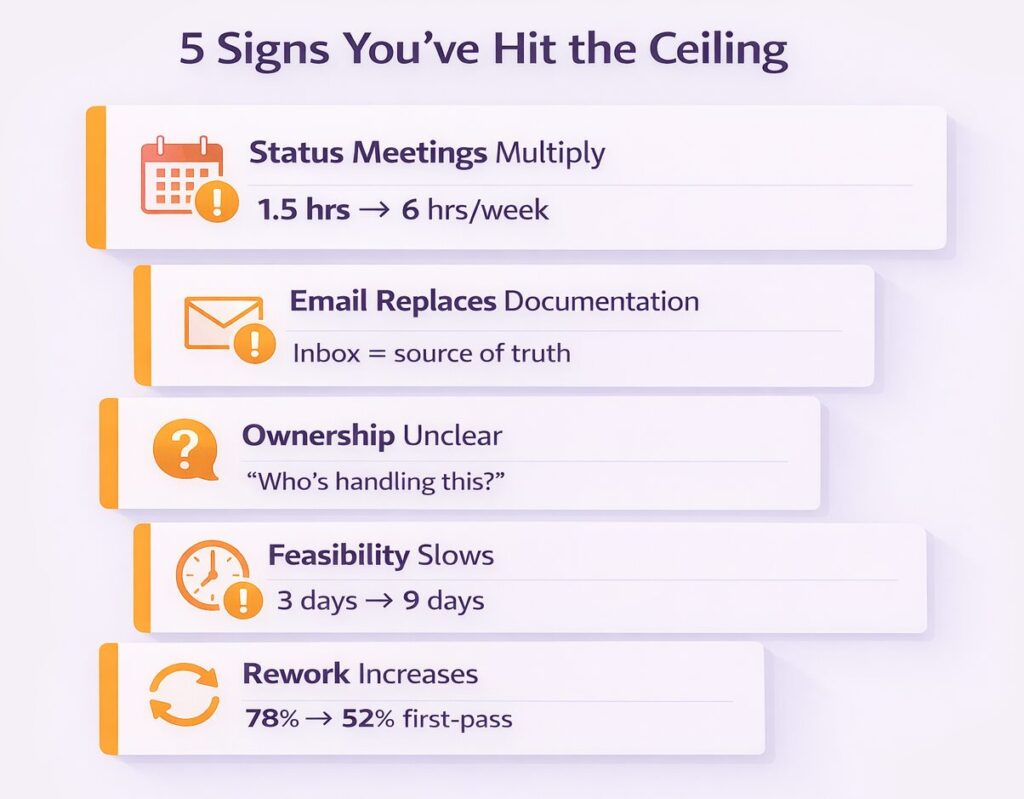
Before performance collapses entirely, sites exhibit predictable warning signs. Recognizing these early gives you time to adjust before sponsors notice the delays.
⚠️ The Normalized Delay Trap
Sites that consistently hit 90-day startups often stop seeing this as a problem. They normalize the delay. Don’t benchmark against your own slow performance. Benchmark against top-quartile sites in your phase category.
Sign 1: Status Meetings Multiply
You used to have one weekly huddle. Now you have three. One per study. Each meeting exists because no one can answer “where are we?” without gathering everyone in a room. If your team spends more than two hours per week in meetings just to sync on status, you’ve exceeded your manual tracking capacity.
Sign 2: Email Threads Replace Documentation
When a sponsor asks for an update, your first instinct is to search your inbox. Not your tracker. Not your shared drive. Your inbox. This means your documentation system has been abandoned in favor of whatever’s easiest to access. The problem: email threads aren’t searchable by anyone else on your team.
Sign 3: The PI Starts Asking “Who’s Handling This?”
In a well-functioning startup process, ownership is clear. When the PI repeatedly asks who’s responsible for a task, it signals that handoffs are failing. Tasks are falling into gaps between people. No one is explicitly assigned, so no one takes action.
Sign 4: Feasibility Responses Slow Down
Your site used to respond to feasibility questionnaires within 48 hours. Now it takes a week. Not because you’re not interested in new studies. Because your team is buried in the administrative noise of current startups. Every day you delay a feasibility response, you risk losing a study to a competitor site. This is how communication gaps cost you future revenue.
Sign 5: Rework Rates Increase
Your IRB submissions used to go through on the first pass. Now you’re getting revision requests on 40% of submissions. This isn’t because your team forgot how to write a protocol summary. It’s because they’re rushing, context-switching, and missing details they would have caught with more focus.
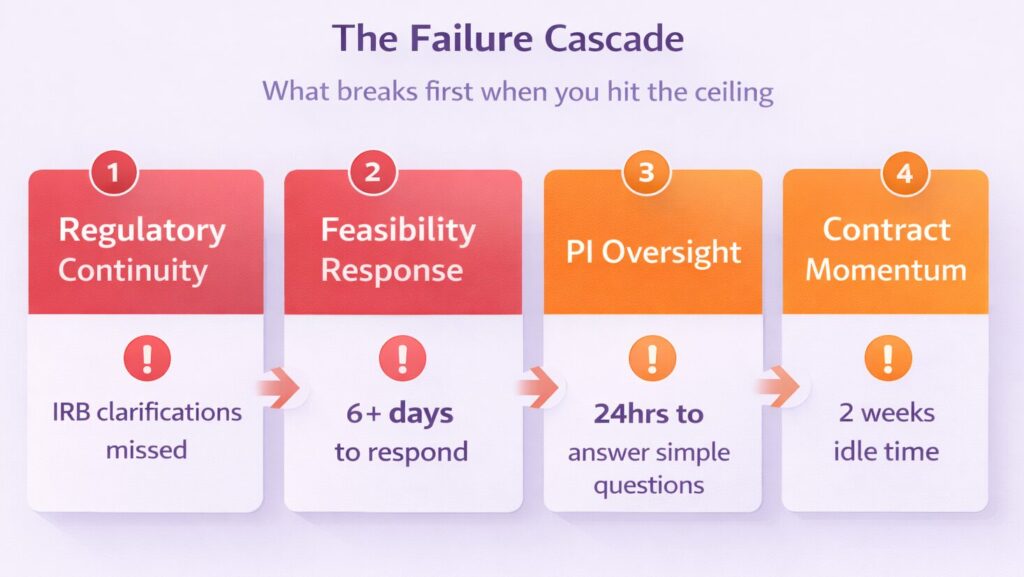
Which site operations break first during parallel startup?
When a site hits its complexity ceiling, these four areas usually collapse first. Understanding the sequence helps you prioritize where to build resilience.
1. Regulatory Continuity
You miss an IRB clarification for Study B because your dedicated coordinator is tied up in the Site Initiation Visit (SIV) for Study A.
What this looks like in practice
The IRB sends a clarification request on Tuesday. Your coordinator sees it but is preparing for Thursday’s SIV. They plan to address it Friday. By Friday, three other urgent tasks have emerged. The clarification sits for another week. The IRB sends a reminder. Your approval timeline just extended by 10 days.
Downstream Impact
Regulatory delays cascade. A missed IRB deadline pushes back your SIV date. That pushes back your first patient screening. Sponsors track these timelines. Multiple delays affect your site’s reputation for future studies.
2. Feasibility Responsiveness
You start ignoring new feasibility requests from sponsors. This happens even for high-value trials because the administrative noise from current startups is too loud.
What this looks like in practice
A sponsor sends a feasibility questionnaire for a Phase III oncology study. Perfect fit for your patient population. The email sits in the inbox for six days. By the time you respond, the sponsor has already selected five other sites.
Downstream Impact
Feasibility is your pipeline. Every missed response is a potential study lost. Over a year, this compounds into significant revenue impact. We’ve written about how to scale feasibility response without scaling your team.
3. PI Oversight
You can’t tell your Principal Investigator where a study stands without calling a 30-minute status meeting.
What this looks like in practice
The PI asks a simple question: “When will Study B be ready for first patient?” The study manager doesn’t know without checking three different spreadsheets, confirming with the regulatory coordinator, and verifying the contract status. What should take 10 seconds takes 24 hours to answer definitively.
Downstream Impact
PIs who can’t get quick answers stop asking. They disengage from startup oversight. When issues arise, they’re discovered late. The PI’s clinical expertise, which could help unblock problems, stays on the sideline.
4. Contract Momentum
Redlines sit untouched. Not because they are difficult, but because the next step isn’t clearly assigned in a shared view.
What this looks like in practice
Legal returns a contract with sponsor edits. The study manager sees the email but assumes the PI needs to review the indemnification language first. The PI assumes legal already handled it. Two weeks pass. The sponsor follows up. Everyone scrambles.
Downstream Impact
Contract delays are the longest pole in most startup timelines. A contract that sits for two weeks waiting for internal clarity adds two weeks to your activation date. Every time. There’s a reason fixing bottlenecks starts with visibility into contract status.
How can sites manage multiple studies without losing control?
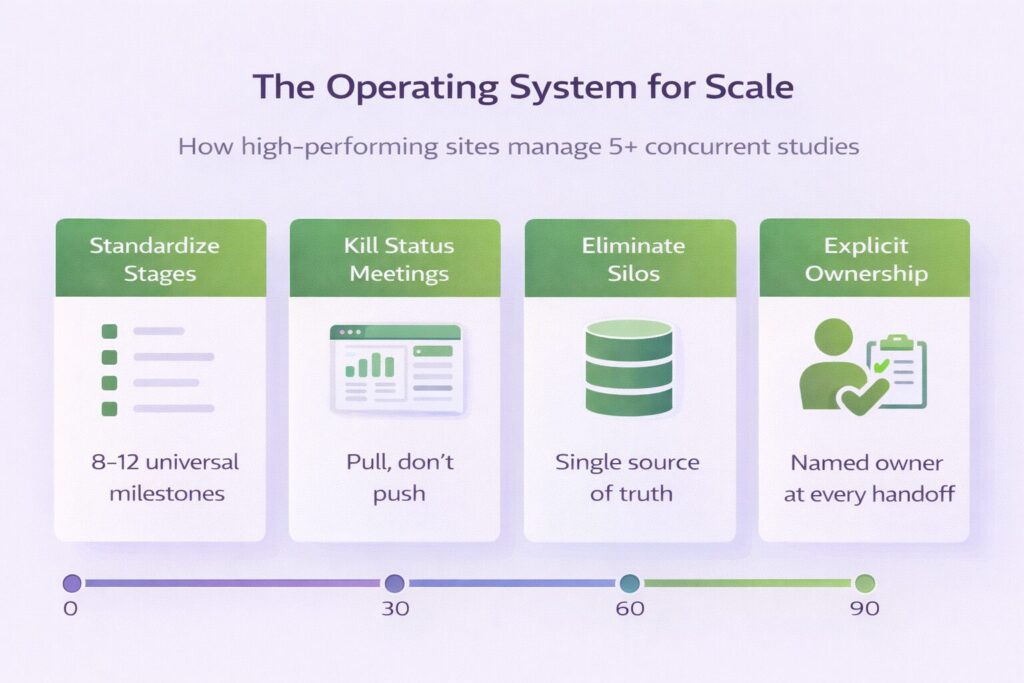
You don’t need more staff. You need a different operating system. Here’s how high-performing sites scale without proportionally scaling headcount.
Standardize the Stages
Don’t let every sponsor dictate your internal workflow. Use a master “Startup Lifecycle” with universal milestones. Examples include Feasibility Received, Regulatory Packet Sent, and Contract Fully Executed. This allows your team to look at a portfolio and see exactly where the logjam is across all trials.
How to implement this:
- Map your last five studies to identify common milestones
- Create a master list of 8-12 stages that apply universally
- Define clear entry and exit criteria for each stage
- Train your team to classify every study using these stages
The goal isn’t to ignore sponsor-specific requirements. It’s to create a common language internally so that “Study A is in Stage 4” means the same thing as “Study B is in Stage 4.” This consistency is what enables portfolio-level visibility.
Kill the Status Meeting
Effective sites move to a “pull” model of communication. The PI or Manager should be able to pull the status from a dashboard in ten seconds. If you are still “pushing” information through weekly meetings, you are paying the maximum Coordination Tax.
How to implement this:
- Identify the five questions your status meetings answer
- Build a view (digital or physical) that answers those questions without conversation
- Replace the meeting with a 15-minute exception review: only discuss items that are blocked or off-track
- Track how many hours per week you save
Pro Tip: Start by recording one status meeting. Count how many questions are “Where are we on X?” versus actual problem-solving. If more than 50% is status-seeking, you have a visibility problem, not a communication problem.
Eliminate Spreadsheet Silos
Fragmented Excel sheets are where data goes to die. Move to a relational system where updating a single date updates the entire portfolio view automatically.
How to implement this:
- Audit how many spreadsheets your team maintains for startup tracking
- Identify which spreadsheets duplicate information
- Consolidate into a single source of truth, even if it’s still a spreadsheet initially
- Add clear ownership: one person is responsible for accuracy
The specific tool matters less than the discipline. Whether you use a sophisticated platform or a well-structured Google Sheet, the principle is the same: one update should propagate everywhere.
Assign Explicit Ownership at Handoffs
The gap between stages is where tasks die. Every handoff needs a named owner and a next action.
How to implement this:
- For each stage transition, document who owns the next action
- Make ownership visible in your tracking system
- When a stage completes, require the outgoing owner to notify the incoming owner directly
- Review handoff failures in your retrospectives
This sounds basic. It is. But basic failures cause most delays. When you ask “why did this contract sit for two weeks?” the answer is almost always “no one knew whose turn it was.”
Case Study: Site A — Midwest Academic Center
A mid-size academic research center provides a clear example of what happens when a site hits the complexity ceiling and what it takes to break through.
Site Profile
Site A is a 200-bed academic medical center running clinical trials across multiple therapeutic areas. Their team of 2 regulatory coordinators, 2 CRCs, and 2 study managers had operated successfully with 2 concurrent studies for several years, using shared Excel trackers and weekly status meetings.
Baseline (Q1 2025)
Performance with 2 concurrent studies was solid:
Days to Activation
IRB First-Pass
Days Feasibility
Hrs Meetings
Days Handoff
The Challenge
Over 18 months, Site A scaled from 2 to 5 concurrent studies. By study #4, cracks were visible. By study #5, the system had collapsed.
What Broke (With 5 Studies)
| Metric | Baseline (2 Studies) | Stressed (5 Studies) | Change |
|---|---|---|---|
| Median days to activation | 72 days | 118 days | +64% |
| First-pass IRB approval rate | 78% | 52% | -33% |
| Feasibility response time | 3 days | 9 days | +200% |
| Weekly status meeting hours | 1.5 hrs | 6 hrs | +300% |
| Average handoff latency | 4 days | 14 days | +250% |
“We went from knowing exactly where everything stood to spending half our week just trying to figure out where everything stood.”
— Study Manager, Site A
Intervention (Q2-Q3 2025)
The site implemented three core changes over a 90-day period:
Every study, regardless of sponsor, was mapped to the same internal stages. This eliminated the “where are we?” question because everyone used the same language.
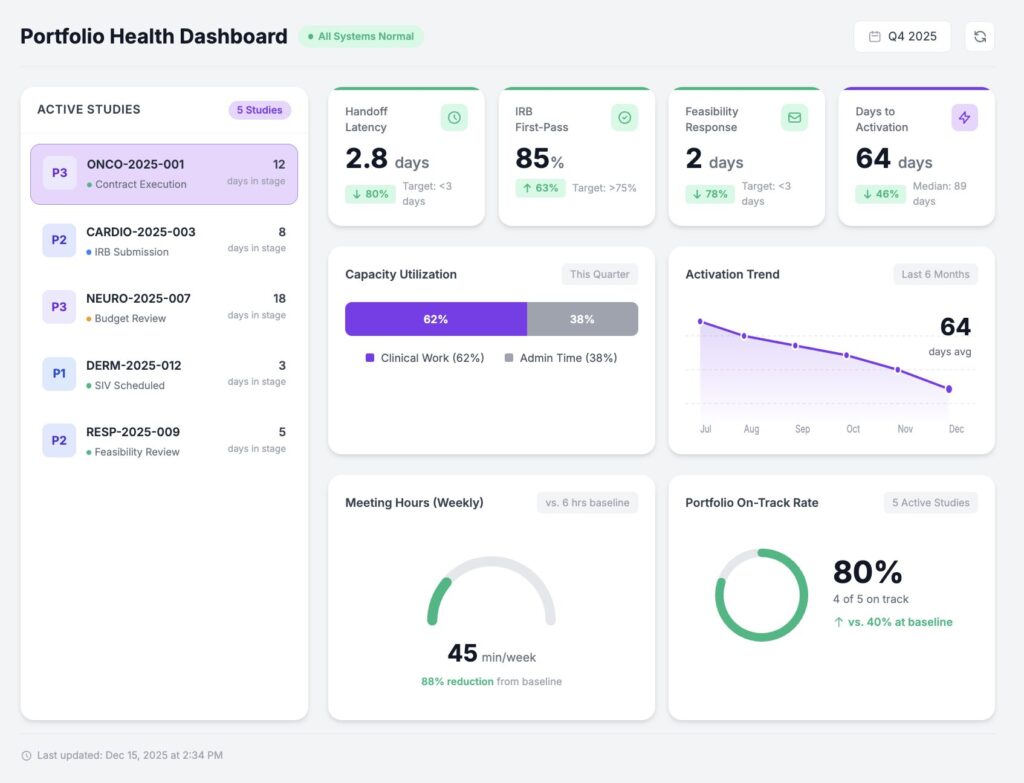
They built a simple view showing all 5 studies, their current stage, days in stage, and next owner. The 6 hours of weekly meetings dropped to a single 45-minute exception review.
For each stage transition, they documented who was responsible for the next action. No task could move forward without a named owner.
Results (Q4 2025)
| Metric | Before Fix | After Fix | Improvement | Industry Median |
|---|---|---|---|---|
| Median days to activation | 118 days | 64 days | ↓ 46% | 89 days |
| First-pass IRB approval rate | 52% | 85% | ↑ 63% | 65% |
| Feasibility response time | 9 days | 2 days | ↓ 78% | 5 days |
| Weekly status meeting hours | 6 hrs | 45 min | ↓ 88% | — |
| Average handoff latency | 14 days | 2.8 days | ↓ 80% | 8 days |
Industry medians from Tufts CSDD (2023)
Key Takeaway: The Coordination Tax isn’t inevitable. It’s a symptom of systems that weren’t designed for scale. When you standardize stages, make status visible, and assign explicit ownership, you can grow your portfolio without proportionally growing your overhead. Site A now runs five studies with better performance than when they ran two. They didn’t add staff. They changed how they operated.
What metrics should PIs track across a portfolio?
Does your current reporting tell you which study is actually costing you the most in idle time? Sound familiar? Stop tracking “busyness” and start tracking velocity.
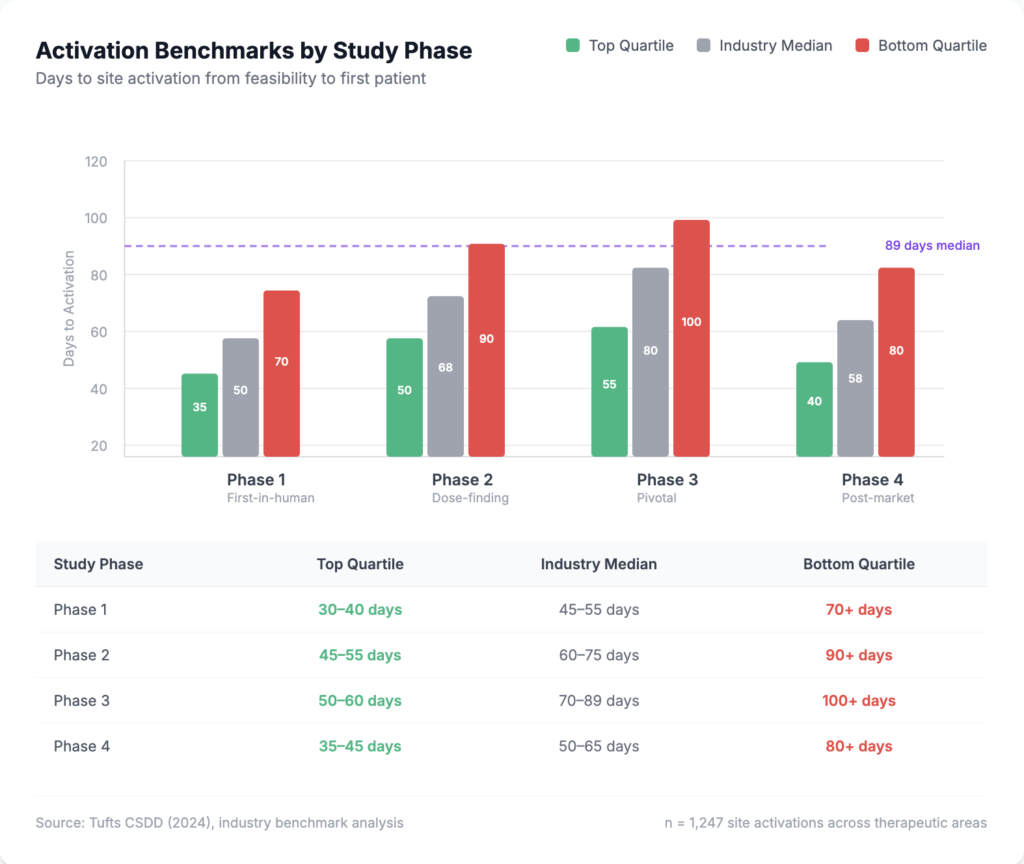
Phase-Specific Activation Benchmarks
Not all studies are equal. These benchmarks measure startup cycle time – from feasibility acceptance to site activation – for each clinical trial phase. Phase 3 pivotal trials naturally take longer to activate than simpler Phase 1 studies. Compare your performance against phase-appropriate targets:
| Study Phase | Top Quartile | Industry Median | Bottom Quartile |
|---|---|---|---|
| Phase 1 | 30-40 days | 45-55 days | 70+ days |
| Phase 2 | 45-55 days | 60-75 days | 90+ days |
| Phase 3 | 50-60 days | 70-89 days | 100+ days |
| Phase 4 | 35-45 days | 50-65 days | 80+ days |
Source: Tufts CSDD (2024)
Key Metrics to Track Weekly
Portfolio Handoff Latency
Average days between when one task completes and the next task begins. Target: under 3 days for top performers.
First-Pass IRB Rate
Percentage of submissions approved without revisions. Measures quality of regulatory preparation under portfolio pressure.
Capacity Utilization (Admin Time)
Percentage of staff time on administrative overhead vs. study-advancing work. If this exceeds 40%, you’re paying excess Coordination Tax.
Days to Activation by Study Type
Benchmark against phase-appropriate targets. A Phase I study should activate faster than a Phase III pivotal trial.
You can start by building a minimal viable startup dashboard to track these core metrics. You don’t need enterprise software to get started. You need the discipline to track and review weekly.
Pro Tip: Review these four metrics weekly with your team for 90 days. The act of measurement alone typically improves performance by 10-15% before you make any process changes.
90-Day Implementation Plan
Success in study startup isn’t about working harder. It’s about reducing the friction that stops your team from working. Here’s how to systematically eliminate the Coordination Tax.
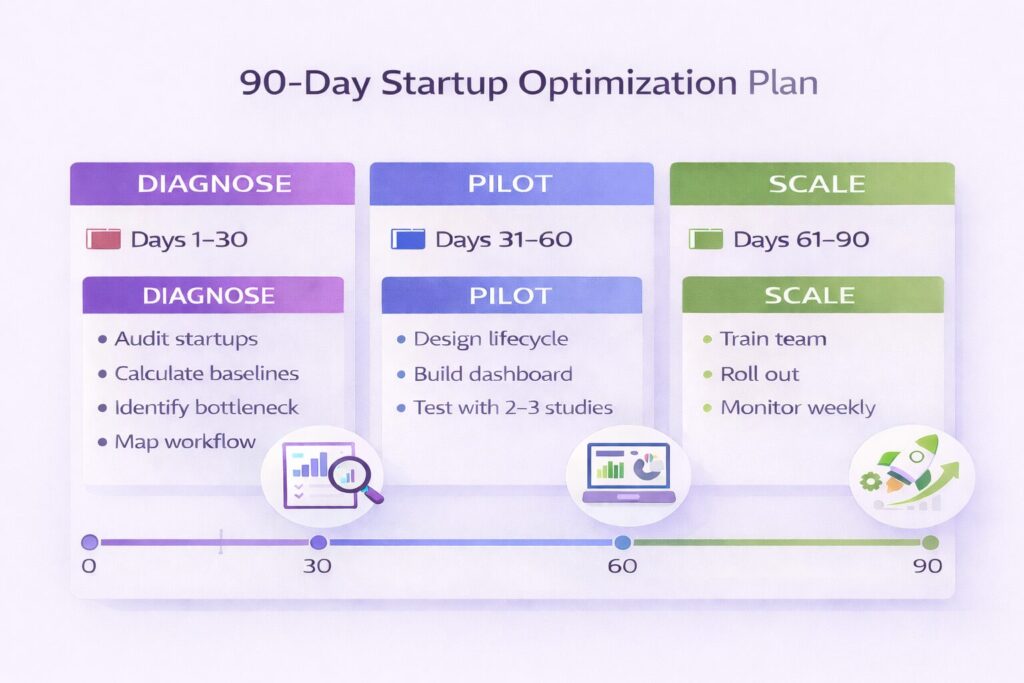
Goal: Understand your current state and identify the primary bottleneck.
Activities:
- Week 1: Audit your last 5-10 study startups for stage-by-stage timing
- Week 2: Calculate baseline metrics (handoff latency, IRB first-pass rate, meeting hours)
- Week 3: Identify top bottleneck by total days lost
- Week 4: Map current-state workflow for that bottleneck
Goal: Test a solution on limited scope.
Activities:
- Week 5: Design a standardized 8-12 stage startup lifecycle
- Week 6: Build a simple portfolio visibility view (even in Excel)
- Week 7-8: Apply to 2-3 active startups; measure the same metrics
Goal: Roll out to all studies and establish sustainability.
Activities:
- Week 9: Train team on new process and lifecycle stages
- Week 10: Roll out to all new and active startups
- Week 11-12: Monitor adoption and metrics weekly; adjust as needed
Frequently Asked Questions
Why shouldn’t we just use a master Excel sheet for all our studies?
Excel lacks state logic. It can’t alert you when a task is overdue. It won’t notify a PI when a signature is needed. Multiple people editing one sheet inevitably leads to shadow trackers and version confusion. Excel also doesn’t support role-based views, so your regulatory coordinator sees the same overwhelming data as your PI. The tool isn’t inherently bad. It just wasn’t designed for multi-user, multi-study coordination.
How do we know if we’ve hit our site’s complexity ceiling?
If your team spends more than two hours per week in meetings just to get updates on where things stand, you have exceeded your manual tracking capacity. Other indicators: increasing IRB rework rates, missed feasibility deadlines, and PIs who stop asking for updates because getting answers takes too long.
Should regulatory staff be specialized by study or by task?
Task specialization usually scales better. It reduces context-switching. One person can master the IRB process across all studies. This lowers the Coordination Tax for everyone. Study specialization works for very complex therapeutic areas but creates single points of failure. If your “Study A regulatory coordinator” is out sick, no one can cover effectively.
Does TrialConnx replace our CTMS?
No. TrialConnx is built to solve the high-speed coordination and visibility gaps that traditional CTMS platforms often skip during the startup phase. Your CTMS is designed for study execution: patient visits, data collection, and monitoring. TrialConnx focuses specifically on the pre-activation chaos where most sites struggle. Think of it as a specialized tool for startup, not a replacement for your full study management stack.
At what point should we invest in dedicated startup software versus improving our processes?
Start with process improvement. Standardize your stages, define ownership, and consolidate your tracking. If you’ve done this and still can’t achieve visibility across 3+ concurrent startups, you have a tooling gap. The software pays for itself when it saves more staff hours than it costs in subscription fees. Most sites see ROI when they’re running 4+ concurrent studies.
How do academic sites differ from independent sites in hitting this ceiling?
Academic sites often hit the ceiling earlier because of additional institutional layers: IRB committees with longer review cycles, institutional contract negotiations, and departmental approval requirements. Independent sites have more agility but fewer resources. Both hit the same breaking point; the specific bottlenecks differ. Academic sites typically struggle more with regulatory continuity; independent sites struggle more with PI oversight across multiple physicians.
Ready to Eliminate the Coordination Tax?
Success in study startup isn’t about working harder. It’s about reducing the friction that stops your team from working.