Quick Answer
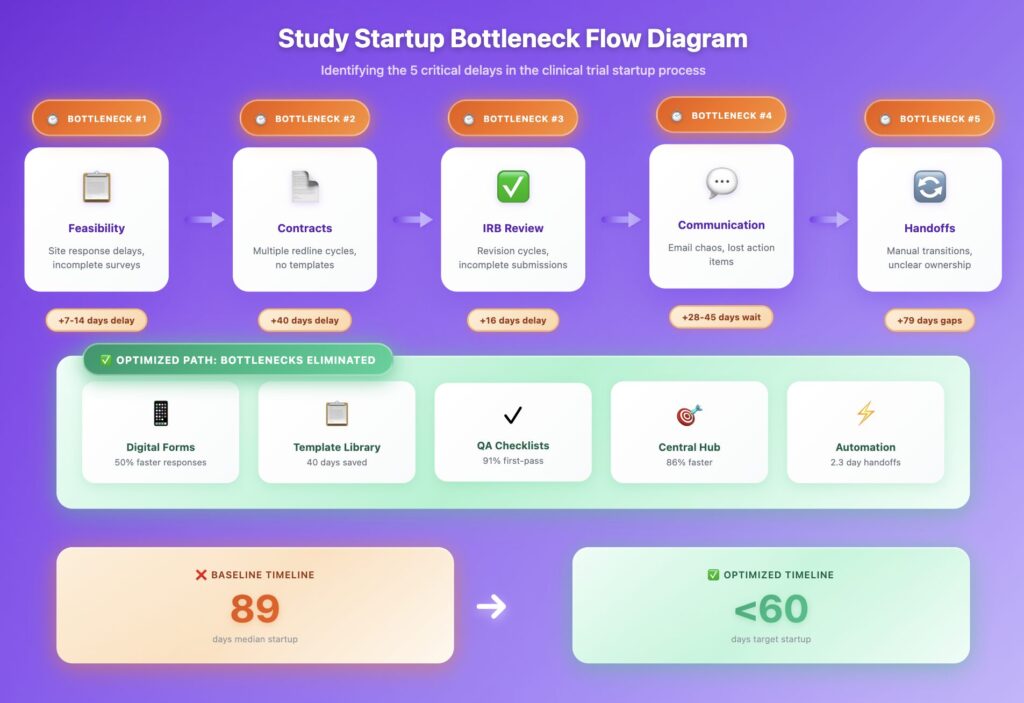
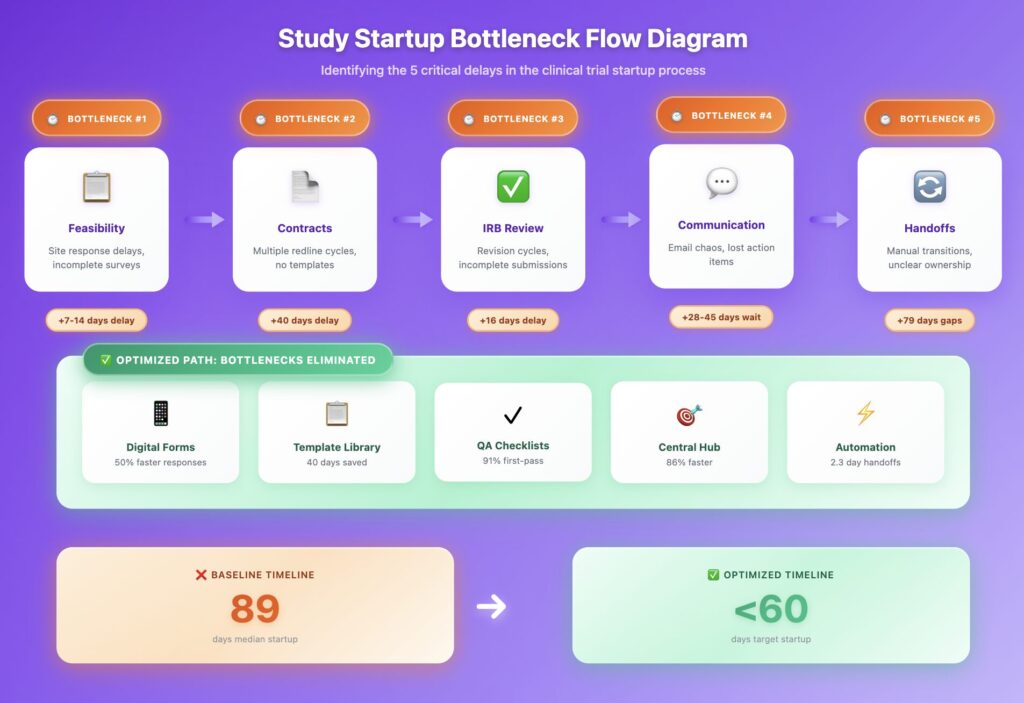
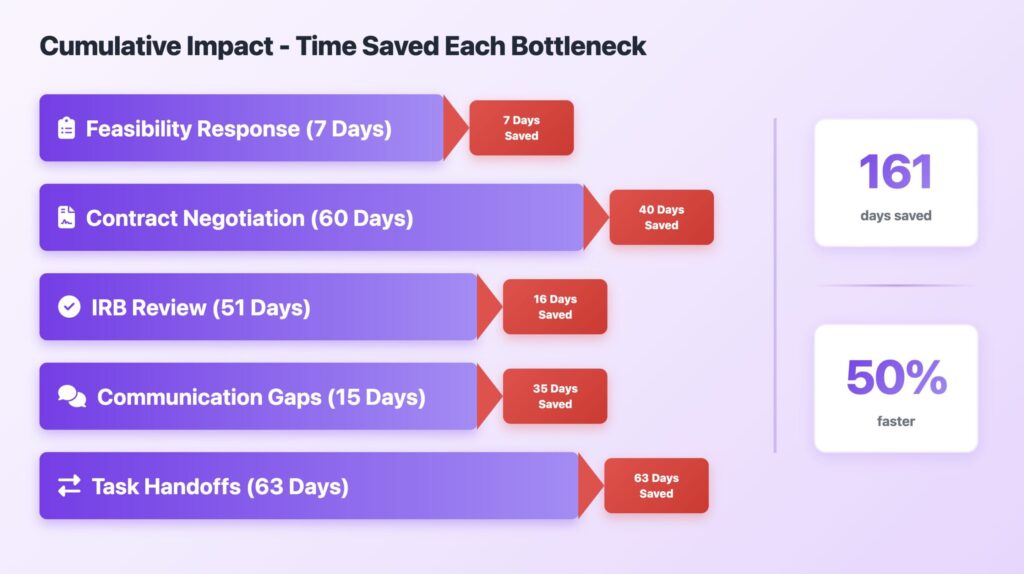
The five most time-consuming bottlenecks in study startup (feasibility delays, contract negotiations, IRB reviews, communication gaps, and task handoffs) account for an average of 40-100+ days of idle time per protocol. Each bottleneck has proven fixes: structured digital forms for feasibility (saves 50% collection time), standardized contract templates (saves 40 days), parallel processing for IRB review (eliminates 22-day gaps), centralized communication platforms (reduces 40-65 days of waiting), and automated task transitions with SLA tracking (reduces handoffs from 18 days to 2.3 days). Implementing these tactical fixes reduces your study startup timeline by 30% or more, saving 5+ months on average.
Why Startup Bottlenecks Cost More Than You Think
In our first post on study startup metrics, we identified that 95% of activity cycle time is idle or waiting time—not active work. Then in our benchmarking guide, we showed the median study startup timeline is 89 days. Top-performing sites? They activate in under 60 days.
What separates the top quartile from everyone else? They’ve systematically eliminated bottlenecks.
of trials experience delays
Most due to startup bottlenecks
Cost per day of delay
Financial impact compounds quickly
of total trial timeline
You spend on site selection & startup
The data is clear: each bottleneck you eliminate directly translates to faster patient enrollment, reduced costs, and competitive advantage. A 50% reduction in site activation time? That’s a 30% cut in enrollment cycle time. You’ll save over five months on the typical 490-day enrollment cycle.
This guide gives you tactical, evidence-based fixes for each of the five most common bottlenecks. No theory. Just proven strategies from sites that consistently beat industry benchmarks.
Feasibility Response Delays
❌ Why it happens
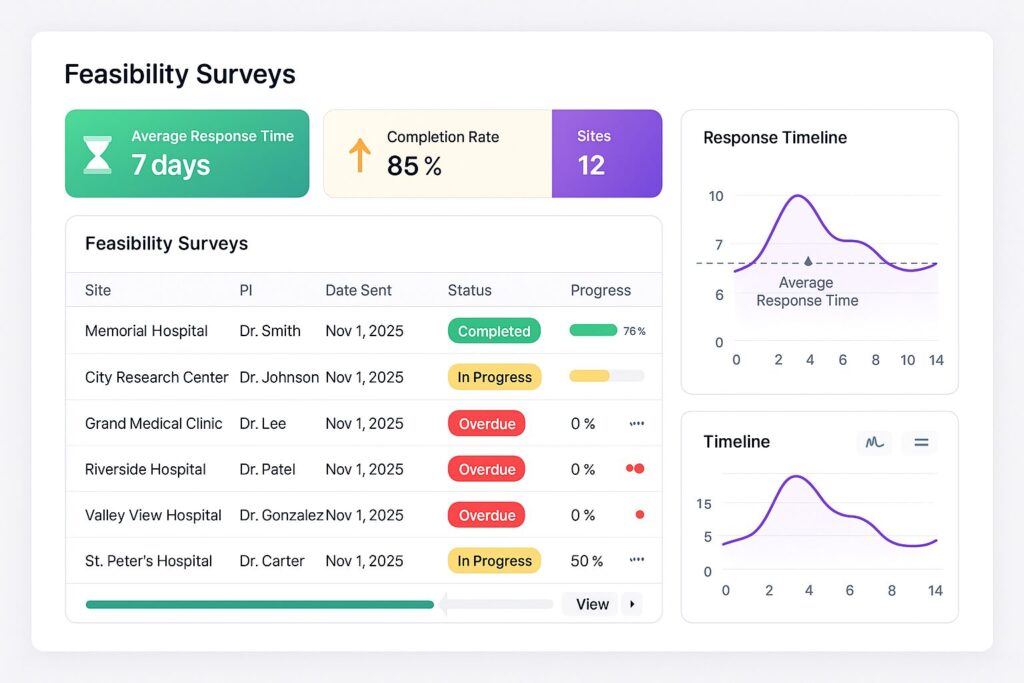
Unclear ownership of feasibility surveys, missing or ambiguous data fields, manual email chains across multiple stakeholders, and lack of follow-up automation. Result: 25% of sites fail to return completed feasibility surveys, and site selection accounts for up to 30% of total trial timelines.
✅ The fix
Implement structured digital forms that pre-fill your site data, automate reminders, assign roles clearly, and provide real-time dashboards. This cuts your data collection time by 50%.
Technology Solution
Tactical Implementation Steps
Create Standardized Digital Forms
What to do:
- Build templates with conditional logic (only show relevant questions based on study phase/indication)
- Pre-populate known site data (PI credentials, IRB type, patient population estimates)
- Include inline help text and examples for ambiguous questions
Pro Tip:
Use electronic confidentiality agreements (eCDAs) to accelerate the initial data collection phase by 50%.
Implement Automated Follow-Up Workflows
What to do:
- Day 3: Auto-reminder if no response
- Day 5: Escalation to site administrator
- Day 7: Study manager notification with partial completion data
- Track “time to first response” and “time to completion” separately
Assign Clear Ownership
What to do:
- Single accountable person per protocol (not “the feasibility team”)
- Visible progress dashboard showing all incoming protocols and your response status
- SLA tracking: Target response within 5 business days
📈 Real-World Impact
❌ Before
Baseline feasibility time
✅ After
With digital forms
💰 Average savings: 7 days per protocol + 50% reduction in incomplete responses
⚠️ Is Feasibility Your Bottleneck?
- Do you know exactly how many days it takes to submit 80% of feasibility surveys?
- Can you see in real-time which protocols you haven’t responded to?
- Are your feasibility questions standardized across all protocols?
- Do you spend more than 30 minutes completing your feasibility survey?
Contract Redline Cycles
❌ Why it happens
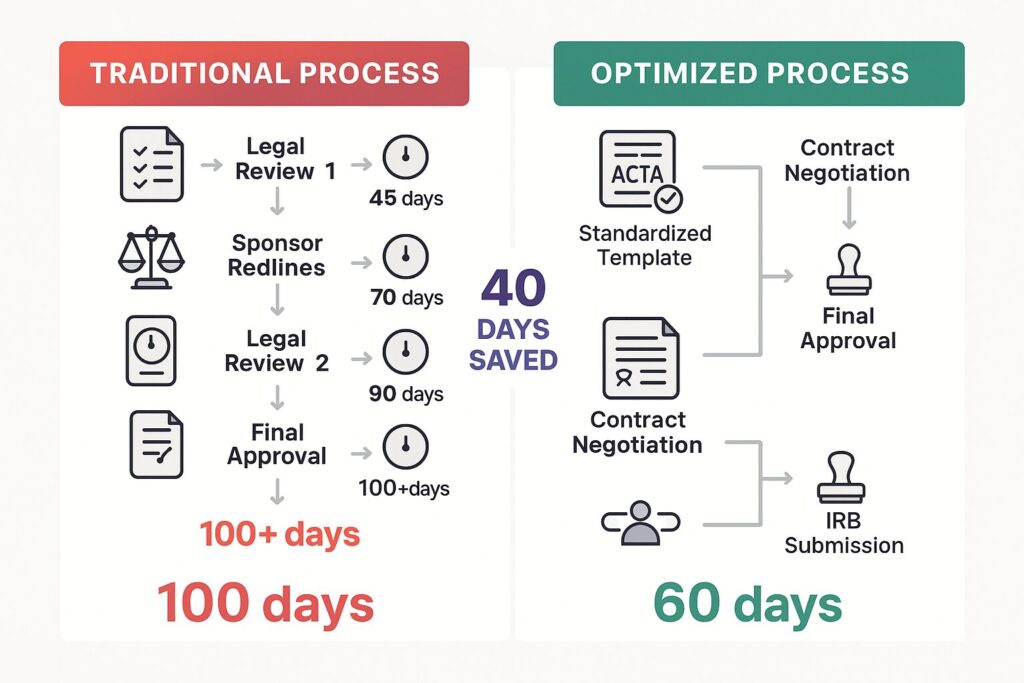
Undefined negotiation thresholds, untracked version control, lack of standardized fallback clauses, and serial (not parallel) review processes. Result: Average contract negotiation takes over 100 days, with 6 key areas causing most delays: intellectual property, study data ownership, indemnification, subject injury clauses, confidentiality, and publication rights.
✅ The fix
Standardized contract templates with pre-approved fallback language, parallel review workflows, version control dashboards, and escalation protocols reduce negotiation time by an average of 40 days.
Process Improvement
Tactical Implementation Steps
Adopt Standardized Agreement Templates
What to do:
- Use industry templates like ACTA (Accelerated Clinical Trial Agreement) or MAGI (Master Agreement for Global Investigator-Initiated Trials)
- Pre-negotiate institutional “must-haves” vs. “negotiables” with legal team
- Create playbooks for the 6 common sticking points with 2-3 fallback positions each
- Track which clauses cause the most back-and-forth per sponsor
Pro Tip:
Organizations using ACTA templates save an average of 40 days on contract negotiations.
Implement Parallel Processing with IRB
What to do:
- Submit to IRB while contracts are in negotiation (not after)
- Studies show a 22-day gap between contract finalization and IRB submission. Eliminate this gap
- Use a checklist to identify dependencies vs. parallel-track activities
Create Contract Dashboards
What to do:
- Track every contract’s current version, who’s reviewing, days in queue, and pending action items
- Set SLA targets: Initial draft response within 5 days, redline turnaround within 3 days
- Automatically flag contracts exceeding 60 days for executive escalation
📈 Real-World Impact
❌ Industry Average
Traditional negotiation
✅ With Templates
Standardized approach
💰 Average savings: 40 days per contract + reduced legal costs
ACTA Templates
Template
Industry-standard clinical trial agreement templates pre-approved by major institutions.
- Reduces initial draft time by 75%
- Pre-negotiated common clauses
Contract Playbooks
Process
Pre-approved fallback positions for common negotiation points.
- Empowers site coordinators
- Reduces legal escalations by 60%
Version Control Dashboards
Technology
Real-time visibility into contract status and review timelines.
- Eliminates “lost” contracts
- Automatic escalation alerts
⚠️ Is Contract Negotiation Your Bottleneck?
- Do you track the average number of redline cycles per contract?
- Can you identify which specific clauses cause 80% of delays?
- Are you running IRB and contract processes in parallel or sequentially?
- Does your legal team have pre-approved fallback language for common issues?
IRB Review Lag
❌ Why it happens
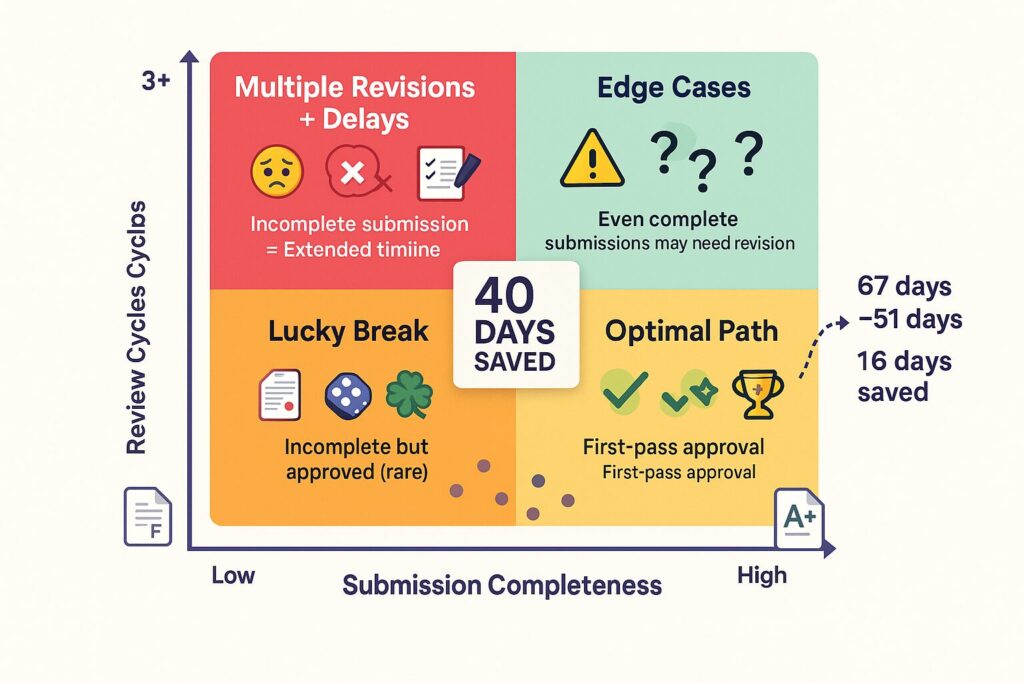
Disorganized submission packages, incomplete documentation on first pass, local IRB queue management, and lack of preparation for common revision requests. Result: IRB review times range from 13 to 116 days depending on submission quality and IRB workload, with incomplete initial submissions adding 2-3 review cycles.
✅ The fix
Submission checklist automation, first-pass quality assurance reviews, parallel budget preparation, and proactive response to common IRB questions reduces review time by 20-30% and eliminate multiple revision cycles.
Process Improvement
Tactical Implementation Steps
Implement Pre-Submission QA Checklists
What to do:
- Create IRB-specific checklists covering all required documents (protocol, ICF, recruitment materials, investigator CV, etc.)
- Include common revision requests from your IRB’s past 20 submissions
- Assign internal QA reviewer (separate from submission preparer) to verify completeness
- Target: 95%+ first-pass approval rate
Real Example:
One academic medical center implemented pre-submission QA and saw IRB approval time drop from 67 days to 51 days (24% improvement) with readiness rate increasing from 64% to 91%.
Prepare for Predictable IRB Questions
What to do:
- Analyze your last 50 IRB revision requests. Identify the top 10 most common questions
- Build response templates or proactively address them in initial submission
- Common areas: informed consent language, vulnerable populations, data security, adverse event reporting
- Include explanatory cover letters highlighting protocol-specific considerations
Run Budget Prep in Parallel
What to do:
- Don’t wait for IRB approval to finalize budgets. Start during IRB review
- Use the review period to negotiate financial terms and coverage analysis
- Have budget ready to execute within 48 hours of IRB approval
⚠️ Is IRB Review Your Bottleneck?
- What percentage of your submissions get approved on first review?
- Do you track the most common revision requests from your IRB?
- Are you using the IRB review period to advance other startup activities?
- Do you have submission checklists that are actually followed (not just documented)?
Stakeholder Communication Gaps
❌ Why it happens
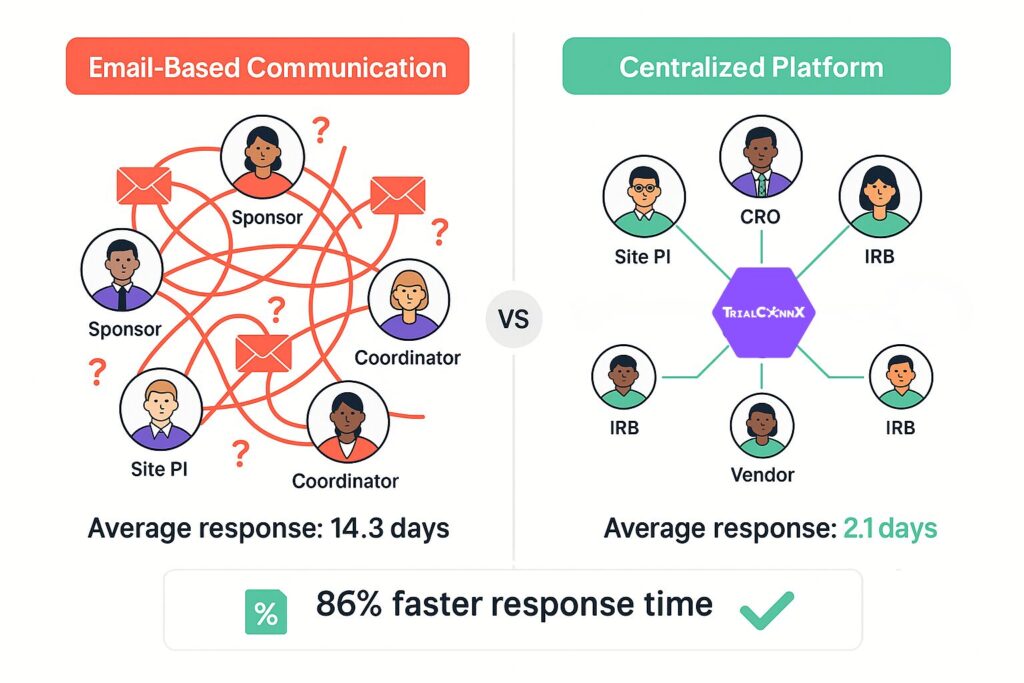
Siloed email chains across sponsors, CROs, sites, and vendors; unclear ownership of action items; lack of centralized documentation; and no visibility into who’s waiting on whom. Result: 40-65 days of pure waiting time per protocol, with stakeholders often unaware they’re the current blocker.
✅ The fix
Centralized communication platforms with threaded discussions, role-based alert routing, visible accountability (who has the ball), and @ mentions for direct assignment eliminate communication black holes and reduce waiting time by 50-70%.
Technology Solution
Tactical Implementation Steps
Implement Centralized Communication Hub
What to do:
- Replace email chains with protocol-specific discussion threads
- Require all stakeholder communication in one platform (no side conversations)
- Thread discussions by topic (Budget, Regulatory, Site Questions, etc.)
- Auto-archive conversations with full searchable history
Common Mistakes to Avoid:
❌ Don’t just add another tool. Replace email as the default communication method. Half-adoption creates more chaos.
Implement Role-Based Alerts
What to do:
- Route notifications based on stakeholder role and task type
- Sponsors get contract questions, PIs get medical queries, coordinators get operational items
- Set escalation timers: If no response in 48 hours → notify manager
- Track “stakeholder response time” as a visible metric
Make Accountability Visible
What to do:
- Every task shows “Current Owner” and “Days in Their Queue”
- Dashboard shows all open items by stakeholder with aging reports
- Use @ mentions to explicitly assign next action (“@JohnSmith – needs your budget approval”)
- Weekly accountability reports showing average response time per stakeholder
📈 Real-World Impact
❌ Baseline
Email-based waiting time
✅ Optimized
Centralized communication
💰 Average savings: 28-45 days per protocol + full audit trail
Protocol-Specific Channels
Technology
Dedicated discussion spaces for each protocol with all stakeholders.
- Eliminates lost emails
- Searchable communication history
Smart Alert Routing
Process
Role-based notifications that reach the right person at the right time.
- 50% faster stakeholder response
- Automatic escalation for delays
Visible Accountability
Process
Always know who’s responsible for the next action.
- Eliminates “ball in whose court?” confusion
- Reduces hand-off delays by 70%
⚠️ Is Communication Your Bottleneck?
- Can you answer “who has the ball right now?” for every active protocol in under 30 seconds?
- Do stakeholders sometimes miss action items because they weren’t included in an email chain?
- How many hours per week do your coordinators spend forwarding emails to the right people?
- Can you reconstruct the full conversation history for a protocol from 6 months ago?
Task Handoff Latency
❌ Why it happens
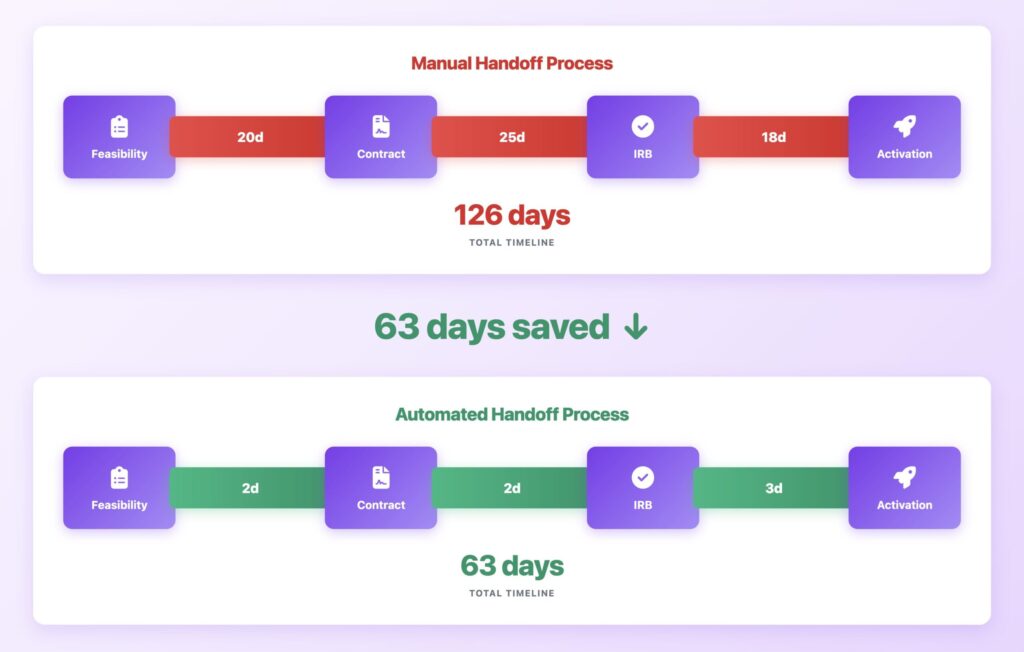
Lack of clear “next-up” ownership, manual notification of task completion, no SLA visibility for downstream activities, and gaps between stage completion and next stage initiation. Result: As we showed in our metrics post, one site reduced handoff latency from 18 days to 2.3 days, demonstrating that most handoff time is preventable delay, not necessary work.
✅ The fix
Automated task transition workflows, pre-assigned next-owner logic, SLA tracking dashboards showing queue time vs. work time, and proactive notifications to the next responsible party eliminate gaps and reduce handoff time by 80-90%.
Technology Solution
Process Improvement
Tactical Implementation Steps
Map Your Handoff Points
What to do:
- Document every stage transition in your startup process (e.g., “Feasibility Complete → Contract Prep Begins”)
- For each handoff, identify: Who hands off? Who receives? What triggers the transition? What’s needed to start the next stage?
- Measure baseline: Current average days between stage completion and next stage initiation
- Target: Reduce handoff gaps to <3 days for all transitions
Automate Transition Notifications
What to do:
- When Stage A is marked complete, automatically notify next owner and create their task
- Include context: “Feasibility is complete. You’re up next for budget review. All data is in the Budget tab.”
- Set auto-escalation: If no action in 72 hours, notify manager
- Track “notification → action” time as a KPI
Implement SLA Dashboards
What to do:
- Define expected completion time for each stage (e.g., “Budget review should take 5 days”)
- Dashboard shows: Current stage, days in stage, SLA target, days remaining/overdue
- Color-coding: Green (on track), Yellow (approaching SLA), Red (overdue)
- Weekly team review of red/yellow items
📈 Real-World Impact
❌ Before
Average manual handoff
✅ After
Automated handoff
💰 Savings: 15.7 days per handoff × 8 handoffs per protocol = 125+ days saved
❌ Manual Handoff
- Person A completes task → emails team
- Email lost in inbox, or person B on vacation
- No one knows task is waiting
- Person B eventually notices 2-3 weeks later
- Average delay: 18 days
✅ Automated Handoff
- Person A marks task complete in system
- Person B immediately notified with context
- Task appears in Person B’s queue with SLA countdown
- Manager sees all pending handoffs in dashboard
- Average delay: 2.3 days
⚠️ Is Task Handoff Your Bottleneck?
- Do you measure “handoff latency” (time between stage completion and next stage start)?
- Can you see all protocols waiting for action in a single dashboard view?
- Are downstream task owners automatically notified when upstream work is done?
- Do you have SLA targets for each stage of your startup process?
Common Mistakes to Avoid
Even with the right fixes in place, teams often stumble in implementation. Here are the four most common mistakes we see, and how to avoid them:
❌ Mistake #1: Measuring Output, Not Flow
What it looks like: Tracking “number of contracts signed” instead of “days contracts spend in negotiation.”
Why it fails: High output doesn’t mean efficient process. You sign 20 contracts and still have a 100-day average negotiation time.
The fix: Track cycle time, waiting time, and handoff latency; not just completion counts. As we discussed in our metrics guide, activity cycle time reveals bottlenecks that output metrics mask.
❌ Mistake #2: Trying to Fix Everything at Once
What it looks like: Rolling out new systems for feasibility, contracts, IRB, communication, AND handoffs in the same month.
Why it fails: Change fatigue, lack of focused training, and no clear measurement of which fix actually worked.
The fix: Bottom line: Use the “one bottleneck per quarter” rule. Identify your biggest delay source (see diagnostic questions above), fix it, measure the impact, then move to the next one.
❌ Mistake #3: Technology Without Process Change
What it looks like: Implementing a new platform but keeping the same manual workflows.
Why it fails: The tool enables efficiency, but doesn’t create it. Teams continue old habits in new software.
The fix: Redesign the process FIRST (map current state, identify waste, design future state), THEN select technology to enable the new process. Process change + technology = real results.
⚠️ Warning Signs Your Fix Isn’t Working
- Adoption rate below 80%: If your team isn’t using the new system/process consistently, it won’t deliver results. Investigate barriers to adoption.
- No change in cycle time after 60 days: Early indicators should appear within 2 months. If not, the fix may not be addressing the root cause.
- Workarounds emerging: If people create “side processes” to get around your new system, you’ve designed for the process, not for the people.
- Metric gaming: Teams marking tasks complete early to hit SLAs without actually finishing work signals misaligned incentives.
Tools & Templates to Get Started
You don’t need to build everything from scratch. Here’s what you can use right now:
📋 Clinical Trial Startup SOP Template
A comprehensive Standard Operating Procedure template covering the entire startup process. Includes pre-populated task lists, role assignments, and timeline benchmarks for each phase.
✅ Feasibility Operations Self-Check Worksheet
Self-assessment tool to evaluate your feasibility workflow, identify bottlenecks, and spot improvement opportunities. Perfect for Bottleneck #1.
📊 Metrics Dashboard Blueprint
Reference our 5 key metrics guide for the essential KPIs to track for each bottleneck type.
📈 Benchmarking Framework
Use our benchmarking guide to compare your current performance against industry standards and top performers.
Your 90-Day Implementation Plan
A phased approach to systematically eliminate bottlenecks without overwhelming your team
Days 1-30: Diagnose & Prioritize
- Week 1: Complete the Bottleneck Assessment for your last 10 protocols
- Week 2: Calculate baseline metrics (handoff latency, contract cycle time, feasibility response time, IRB cycles, stakeholder waiting time)
- Week 3: Identify your #1 bottleneck (the one costing you the most days)
- Week 4: Map current state workflow for that bottleneck, where exactly is time being lost?
Deliverable: One-page summary identifying your primary bottleneck, baseline metrics, and root cause hypothesis.
Days 31-60: Design & Pilot
- Week 5: Design future-state process addressing root cause (standardized templates, automated workflows, parallel processing, etc.)
- Week 6: Select 2-3 pilot protocols to test the new process
- Week 7-8: Run pilot, collecting same metrics as baseline for comparison
Deliverable: Pilot results showing cycle time improvement (target: 20-40% reduction) and documented lessons learned.
Days 61-90: Scale & Sustain
- Week 9: Train all team members on new process, incorporating pilot feedback
- Week 10: Roll out to all new protocols; retrofit in-flight protocols where feasible
- Week 11-12: Monitor adoption and impact metrics weekly; address barriers to adoption
- Week 13: Celebrate wins with team; identify next bottleneck to tackle in Quarter 2
Deliverable: Updated SOP, adoption metrics (target: 80%+ team usage), and measured impact on startup timeline.
Quick Self-Assessment: Which Bottleneck Should You Fix First?
Use this prioritization framework to identify where you’ll get the biggest return on effort:
Feasibility Response Delays (Score: ___/5)
- Our feasibility response time averages >10 days
- We miss 20% of feasibility survey deadlines
- We use email and spreadsheets (not structured digital forms)
- We don’t track which studies are overdue or send automated reminders
- Incomplete feasibility data regularly delays site selection decisions
Score 4-5? This is your top priority. Score 2-3? Address after higher-scoring areas. Score 0-1? You’re in good shape here.
Contract Redline Cycles (Score: ___/5)
- Our average contract negotiation takes >80 days
- We start each contract from scratch (no standardized templates)
- We negotiate IRB and contracts sequentially, not in parallel
- Legal team doesn’t have pre-approved fallback language for common issues
- We lack tracking for in real-time which contracts are in whose queue
Score 4-5? This is your top priority. Score 2-3? Address after higher-scoring areas. Score 0-1? You’re in good shape here.
IRB Review Lag (Score: ___/5)
- Less than 70% of our IRB submissions are approved on first review
- We don’t have a standardized pre-submission QA process
- We lack ability to predict which IRB questions will come back based on past submissions
- Our IRB review time averages >60 days
- We wait for IRB approval before starting budget negotiations
Score 4-5? This is your top priority. Score 2-3? Address after higher-scoring areas. Score 0-1? You’re in good shape here.
Stakeholder Communication Gaps (Score: ___/5)
- Our primary communication method is email (not a centralized platform)
- We regularly lack access to past conversations or decisions
- Stakeholders miss action items because they weren’t CC’d on the right email
- We lack ability to answer “who has the ball?” without asking multiple people
- Our protocols spend 30+ days in stakeholder waiting time
Score 4-5? This is your top priority. Score 2-3? Address after higher-scoring areas. Score 0-1? You’re in good shape here.
Task Handoff Latency (Score: ___/5)
- Our average handoff time (stage complete → next stage start) is >5 days
- We don’t have automated notifications when a task is ready for the next owner
- We don’t track SLA targets for each stage of startup
- Team members manually check if upstream work is done (it’s not proactively communicated)
- We lack visibility into all protocols awaiting action in a single dashboard view
Score 4-5? This is your top priority. Score 2-3? Address after higher-scoring areas. Score 0-1? You’re in good shape here.
Frequently Asked Questions
How long does it take to see measurable improvement after implementing these fixes?
You should see early indicators within 30-60 days, and clear measurable impact within 90 days. Quick wins like automated feasibility reminders show results immediately (within 1-2 protocols). Process changes like standardized contracts take longer since you need a few full cycles to measure the difference. Track leading indicators (adoption rate, stakeholder response time) weekly and lagging indicators (overall startup timeline) monthly.
Do I need expensive software to eliminate these bottlenecks?
Not necessarily. Many fixes are process improvements that require minimal technology (standardized contract templates, pre-submission QA checklists, parallel processing workflows). That said, technology accelerates and scales these improvements. Automated workflows, centralized communication, and SLA tracking are much harder to sustain manually. Bottom line: Start with process redesign, then add enabling technology to lock in the gains.
What if my biggest bottleneck is external (e.g., sponsor contract delays)?
You have more control than you think. For sponsor-side delays: (1) Track and share metrics showing their average response time. Data often drives behavior change, (2) Propose standardized templates like ACTA to reduce negotiation rounds, (3) Run other activities in parallel while waiting (don’t let one delay cascade into total inaction). Even external bottlenecks benefit from visibility, accountability, and proactive communication, all within your control.
Should I fix bottlenecks sequentially or tackle multiple at once?
Sequential is almost always better. Fixing one bottleneck per quarter allows for: (1) Focused team training and change management, (2) Clear measurement of what worked, (3) Higher adoption rates, and (4) Sustained improvement instead of temporary fixes. The one exception: If two bottlenecks are completely independent (e.g., feasibility and IRB QA) and owned by different teams, you run them in parallel. Ensure each team has dedicated focus.
How do I get buy-in from stakeholders who resist process changes?
Three strategies work best: (1) Show the cost. Translate cycle time delays into dollar impact using the $600K-$8M per day figure. Money talks. (2) Start with a pilot,”Let’s test this on 3 protocols and compare results” is less threatening than “we’re changing everything.” (3) Find a champion. Identify one influential team member who sees the value and let them advocate internally. Change management is easier when it comes from peers, not management mandates.
Can these fixes work for small sites with limited staff?
Absolutely,in fact, small teams benefit most from bottleneck elimination because every hour saved has bigger impact. Focus on the highest-ROI fixes first: standardized feasibility forms (minimal effort, big time savings), automated handoff notifications (eliminates manual follow-up), and centralized communication (reduces time spent hunting for information). Small teams should prioritize automation over adding headcount,it’s more sustainable and scales as you grow.
What metrics should I track to know if the fix is working?
Track both leading indicators (early signals) and lagging indicators (final outcomes). Leading: Adoption rate of new process, stakeholder response time, handoff latency, first-pass IRB approval rate, contract redline cycles. Lagging: Overall study startup timeline (from feasibility to first patient), time to IRB approval, contract execution time. Revisit our 5 key metrics guide for detailed definitions and tracking methods.
How do I maintain improvements long-term and prevent backsliding?
Three keys to sustainability: (1) Make metrics visible; dashboards showing cycle time, SLA performance, and handoff latency keep teams accountable. (2) Embed in SOPs; document the new process as the official standard, train all new hires on it. (3) Celebrate wins publicly; share stories of protocols that activated faster, studies that enrolled ahead of schedule. Recognition reinforces behavior change. Finally, assign one person to be the “process owner” responsible for monitoring and continuous improvement.
Ready to Eliminate Your Startup Bottlenecks?
TrialConnx is purpose-built to solve these exact problems. Automated workflows, centralized communication, SLA tracking, and real-time visibility across all stakeholders.
Which bottleneck will you tackle first?
References & Data Sources
- Tufts Center for the Study of Drug Development (CSDD). “Median Study Startup Timelines 2023.” Clinical Trial Study Startup Benchmarks.
- Clinical and Translational Science Awards (CTSA) Consortium. “Observational Study of Contracts Processing at 29 CTSA Sites.” Clinical and Translational Science, 2013. PMC3740442.
- WCG Clinical Research. “2024 Clinical Research Site Challenges Report.” Survey of 500+ research sites.
- Springer Link. “Quantitative assessment of the impact of standard agreement templates on multisite clinical trial start up time.” Journal of Clinical and Translational Science, 2023. PMC10565190.
- Applied Clinical Trials Online. “Clinical Trial Agreement Negotiations: Time and Cost Analysis.” 2024 Industry Report.
- National Center for Advancing Translational Sciences (NCATS). “Drivers of Start-Up Delays in Global Randomized Clinical Trials.” Therapeutic Innovation & Regulatory Science, 2020.
- Association of Clinical Research Professionals (ACRP). “Overcoming Study Start-Up Delays: Best Practices for Research Sites.” May 2025.
- RealTime Software. “How to Accelerate Study Start-up in Clinical Trials: From Feasibility to First Patient In.” July 2025 White Paper.