
Quick Answer
The short answer: Spreadsheets are valuable for basic task lists and single-user scenarios, but they become a operational liability in complex clinical trial startup operations. Industry data shows sites using spreadsheets average 47% longer startup times and experience 3x more coordination errors than sites using purpose-built systems. The critical tipping point typically occurs at 3+ concurrent studies or when 5+ team members need coordinated access to the same operational data.
The Hidden Cost of Spreadsheet Dependency in Clinical Research

2025 Industry Analysis (Based on ACRP Operations Survey 2024 involving 1,200+ clinical research sites):
Beyond the direct financial impact, spreadsheet dependency creates cascading effects on study timeline predictability, sponsor relationships, and the site’s ability to scale operations efficiently. Learn how leading sites optimize operations without expanding teams through systematic process improvements and technology adoption.
Where Spreadsheets Work vs Where They Break Down

When Spreadsheets Are Still Effective
Spreadsheets continue to excel in specific operational scenarios where their flexibility and familiarity provide genuine advantages over more complex systems:
The Breaking Point: 5 Signs You’ve Outgrown Spreadsheets
Warning Sign 1: Multiple People Need Simultaneous Access
When 3+ team members regularly need to update the same tracking documents, version conflicts become inevitable and consume significant time in reconciliation efforts. Email-based sharing creates multiple “versions of truth” that fragment team coordination and increase error rates exponentially.
Warning Sign 2: You’re Managing 5+ Studies Concurrently
Operational complexity grows exponentially with multiple active protocols, each with unique requirements, timelines, and stakeholder coordination needs. Spreadsheets lack the sophisticated filtering, notification, and workflow management capabilities required to maintain oversight across complex portfolios without significant manual effort.
Warning Sign 3: Manual Data Entry Across Multiple Systems
If clinical research coordinators spend 2+ hours daily transferring data between spreadsheets and other systems (EMRs, CTMS platforms, sponsor portals), the opportunity cost and error risk far exceed the benefits of spreadsheet familiarity. This threshold typically represents $15,000+ annually in pure labor costs.
Warning Sign 4: Audit Trail Requirements
Regulatory compliance increasingly demands detailed change tracking, user authentication, and data integrity controls that spreadsheets fundamentally cannot provide. FDA and other regulatory bodies expect robust audit trails that document not just what changed, but who made changes, when, and why.
Warning Sign 5: Cross-Functional Visibility Issues
When Principal Investigators, sponsors, or regulatory teams can’t access real-time progress updates and instead rely on manually generated status reports, communication overhead increases while decision-making speed decreases. This creates bottlenecks that cascade throughout the entire study startup process.
The Hidden Costs of Spreadsheet Dependency
Beyond immediate time waste, spreadsheet dependency creates systemic operational risks that compound over time and affect both current performance and future scalability:
Quality Risks
- Manual transcription errors occur in 12-15% of data transfers according to CDISC 2024 data quality studies
- Inconsistent data validation across team members leads to standardization failures
- Lost audit trails create regulatory inspection vulnerabilities and compliance gaps
Operational Risks
- Single points of failure when key personnel leave, taking institutional knowledge with them
- Limited scalability as research portfolios grow beyond individual management capacity
- Difficulty maintaining SOPs across multiple studies with different requirements and timelines
2025 Clinical Operations Benchmarks: Spreadsheets vs Systems

Industry Performance Data
Study Startup Times by System Type (ACRP Benchmark Study 2024, analyzing 800+ clinical research sites):
Operational Efficiency Metrics demonstrate consistent patterns across multiple performance dimensions:
| Performance Metric | Spreadsheet Sites | Purpose-Built Systems | Performance Gap |
|---|---|---|---|
| Data Accuracy Rate | 78% | 94% | +16 percentage points |
| Team Coordination Satisfaction | 65% | 91% | +26 percentage points |
| Regulatory Readiness Score | 72% | 96% | +24 percentage points |
| Operational Scalability Rating | 45% | 89% | +44 percentage points |
Efficiency Gap Analysis
The performance gap between spreadsheet-dependent and system-enabled sites continues widening year-over-year, creating competitive disadvantages that compound over time:
2020-2025 Trend Analysis reveals diverging performance trajectories:
ROI Comparison: Spreadsheets vs Purpose-Built Systems
Financial Impact Analysis (12-month operational period, typical mid-size clinical research site):
| Cost/Benefit Category | Spreadsheets | Purpose-Built System | Net Benefit |
|---|---|---|---|
| Average Time to Startup | 118 days | 67 days | 43% faster |
| Annual Coordinator Hours | 2,100 hours | 1,450 hours | 650 hours saved |
| Error Correction Time | 180 hours | 45 hours | 135 hours saved |
| Annual System Cost | $0* | $18,000 | -$18,000 |
| Hidden Operational Costs | $35,000 | $8,000 | $27,000 saved |
| Total Annual ROI | – | – | $47,500 net benefit |
*Excludes hidden operational costs including staff time, error correction, coordination overhead, and opportunity costs of delayed studies.
The ROI analysis demonstrates that purpose-built systems typically pay for themselves within 12-18 months while providing ongoing operational benefits that compound annually. See the complete transformation methodology for moving from spreadsheet-dependent to system-enabled operations.
What Leading Sites Use Instead of Spreadsheets for Study Startup
Study Startup Management Platforms
Specialized platforms designed specifically for clinical trial startup operations provide integrated functionality that addresses the coordination, timing, and visibility challenges sites face from contract execution through first patient enrollment:
Integrated Startup Platforms
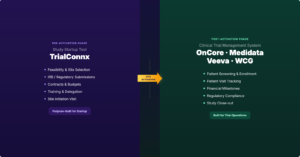
Comprehensive study startup solutions like TrialConnx that manage the entire activation process from feasibility through first patient enrollment, with built-in collaboration tools and sponsor visibility features.
Project Management Tools
Clinical-focused project management platforms that provide timeline tracking, milestone management, and team coordination specifically configured for study startup workflows and regulatory requirements.
Workflow Automation Systems
Specialized tools that automate repetitive startup tasks like document routing, approval processes, and status notifications while maintaining the flexibility needed for diverse protocol requirements.
Study Startup Workflow Solutions
Many successful sites create comprehensive study startup environments by combining specialized tools that focus specifically on the pre-enrollment phase challenges:
Hybrid Study Startup Approaches
Sites transitioning from spreadsheet-dependent startup operations often benefit from hybrid approaches that maintain familiar tools while adding specialized capabilities for the most critical startup coordination challenges:
Startup Platform + Spreadsheets
Use specialized study startup platforms for milestone tracking, stakeholder coordination, and timeline management while maintaining spreadsheets for budget calculations and internal planning that benefit from formula flexibility.
Project Management + Startup Tools
Combine robust project management platforms with startup-specific tools for regulatory tracking, feasibility transition, and sponsor communication to create comprehensive startup coordination without full CTMS complexity.
Document Control + Timeline Tracking
Integrate document management systems with startup timeline tracking tools for compliance-focused operations that require extensive regulatory documentation with coordinated milestone management.
Critical Success Factors for hybrid approaches include clear data ownership and responsibility definitions, standardized integration processes that prevent data duplication, regular system health monitoring to identify coordination issues, and comprehensive team training on all platforms to ensure proper utilization.
Understanding what sponsors prioritize in 2025 helps inform technology decisions that improve both operational efficiency and sponsor relationship management.
4 Common Spreadsheet Mistakes That Delay Study Startup
Mistake 1: Using Spreadsheets as Project Management Systems
Why it happens: The familiar Excel interface feels safer and more controllable than learning new project management tools, especially for teams with limited technology training or change management resources.
The Impact: Complex clinical trial projects require dependency tracking, resource allocation, timeline management, and stakeholder coordination that spreadsheets fundamentally cannot provide. This leads to missed milestones, resource conflicts, and poor visibility into project status across teams.
The Fix: Migrate project tracking to purpose-built project management platforms like Asana, Monday.com, or specialized clinical project management tools that provide proper task dependencies, automated notifications, and real-time collaboration features.
Mistake 2: Manual Data Duplication Across Multiple Sheets
Why it happens: Different stakeholders want customized views of the same underlying data, leading teams to create multiple spreadsheets with overlapping information rather than implementing proper data architecture.
The Impact: Version conflicts become inevitable, update delays cascade across multiple documents, and inconsistent information leads to miscommunication and decision-making based on outdated or incorrect data.
The Fix: Implement a single source of truth database with role-based dashboards that provide stakeholder-specific views without data duplication, using platforms that support customizable reporting and real-time data updates.
Mistake 3: Inadequate Access Control and Audit Trails
Why it happens: Spreadsheets lack sophisticated permission management and change tracking capabilities, but teams continue using them for processes that require regulatory compliance and data integrity controls.
The Impact: Regulatory compliance risks increase substantially, data integrity becomes questionable during audits, and demonstrating proper change control becomes impossible when regulatory inspectors require detailed audit documentation.
The Fix: Migrate compliance-critical processes to platforms with proper user management, detailed change tracking, electronic signatures, and audit trail capabilities that meet 21 CFR Part 11 and other regulatory requirements.
Mistake 4: Treating All Studies Identically
Why it happens: One-size-fits-all spreadsheet templates seem efficient and reduce the perceived complexity of managing multiple different tracking systems across various study types and phases.
The Impact: Unique protocol requirements get overlooked or handled inefficiently, leading to compliance issues, timeline delays, and suboptimal resource allocation as templates fail to accommodate study-specific workflows and regulatory requirements.
The Fix: Implement configurable workflow systems that adapt to study-specific needs while maintaining standardized core processes, using platforms that support template customization and protocol-specific requirement tracking.
Step-by-Step: When and How to Move Beyond Spreadsheets

Step 1: Assess Your Current Spreadsheet Complexity (Month 1)
Comprehensive evaluation of existing spreadsheet dependencies provides the foundation for informed technology decisions and ROI calculations:
Spreadsheet Inventory Audit
Complexity Scoring Framework
Complexity Assessment Criteria
- Multiple concurrent studies (+2 points)
- 5+ regular users requiring coordinated access (+2 points)
- Cross-functional access needs spanning departments (+2 points)
- Regulatory audit requirements and compliance dependencies (+2 points)
- Integration requirements with other systems (+1 point)
- Frequent version control issues and conflicts (+1 point)
- Manual data duplication across multiple files (+1 point)
Step 2: Calculate Your True Cost of Manual Processes (Month 1)
Accurate cost analysis reveals the hidden financial impact of spreadsheet dependency and provides justification for technology investment:
Comprehensive Time Tracking Exercise
Track actual time spent on spreadsheet-related tasks for 2 full weeks during typical operational periods, including both routine maintenance and crisis management activities:
Annual Hidden Cost Calculation
Formula:
Annual Hidden Cost = (Weekly Hours × 52 weeks × Hourly Rate) +
(Error Correction Hours × 52 × Hourly Rate) +
(System Downtime × Revenue Impact) +
(Opportunity Cost of Delayed Studies)
ROI Threshold: If annual hidden costs exceed $15,000 for independent sites or $40,000 for Academic Medical Centers, system investment typically achieves positive ROI within 18 months while providing ongoing operational improvements.
Step 3: Evaluate System Alternatives (Month 2-3)
Systematic evaluation of available alternatives ensures optimal technology selection that matches your operational requirements, budget constraints, and growth objectives:
| Evaluation Criteria | Weight | Spreadsheets | CTMS | Hybrid Approach |
|---|---|---|---|---|
| Initial Implementation Cost | 20% | 10/10 | 4/10 | 7/10 |
| Operational Scalability | 25% | 3/10 | 9/10 | 7/10 |
| Regulatory Compliance | 20% | 4/10 | 10/10 | 6/10 |
| User Adoption Ease | 15% | 9/10 | 6/10 | 8/10 |
| System Integration | 10% | 3/10 | 9/10 | 7/10 |
| Ongoing Support Quality | 10% | 2/10 | 8/10 | 6/10 |
Vendor Evaluation Process
Step 4: Plan Your Migration Strategy (Month 4-5)
Strategic migration planning minimizes operational disruption while ensuring successful adoption and long-term sustainability of new systems and processes:
Big Bang Migration
Timeline: Complete transition within 30-60 days
Best for: Smaller sites with simple workflows and high change tolerance
Benefits: Faster long-term benefits, eliminates dual-system complexity
Risks: Higher short-term disruption, requires extensive preparation
Phased Migration
Timeline: Move one study or function at a time over 3-6 months
Best for: Most sites seeking balanced risk and benefit optimization
Benefits: Lower risk, easier team adoption, maintains operational continuity
Risks: Longer implementation period, temporary process complexity
Parallel Operations
Timeline: Run old and new systems simultaneously for 60-90 days
Best for: Mission-critical operations requiring maximum confidence
Benefits: Highest confidence, extensive validation period
Risks: Resource intensive, potential confusion during transition
Real-World Results: Sites That Made the Switch

Case Study 1: Mid-Size Academic Medical Center
Organizational Profile: 45-bed research facility managing 12 active studies simultaneously with an 8-person multidisciplinary research team including clinical coordinators, regulatory specialists, and administrative support personnel.
Before Implementation
- Average startup time: 127 days with high variability across different protocol types
- Spreadsheet dependency: 23 active tracking files across departments with frequent version conflicts
- Coordination overhead: 18 hours weekly across team for status updates and alignment meetings
- Error rate: 15% of manual data entries required correction, consuming significant administrative time
- Regulatory compliance: 3 minor audit findings related to inadequate documentation and audit trail gaps
After Implementation (8 months later)
- Average startup time: 73 days representing 42% improvement with increased consistency
- Integrated platform: Single dashboard with role-based access eliminating version control issues
- Coordination efficiency: 6 hours weekly (67% reduction) through automated notifications and status tracking
- Error reduction: 3% error rate with automated validation and data quality controls
- Regulatory excellence: Zero audit findings with improved compliance scoring and documentation quality
Implementation Strategy Details: The center selected an integrated CTMS with project management features, implementing a phased migration over 4 months. The approach included 80 hours of comprehensive team training, custom dashboard configuration for each role, and integration with existing EMR and regulatory systems to maintain operational continuity.
Key Success Factors: Strong Principal Investigator leadership and change management commitment, dedicated super-user training program with peer mentoring, comprehensive dashboard customization for each stakeholder role, and seamless integration with existing EMR and regulatory compliance systems.
Case Study 2: Independent Research Site Network
Network Profile: 4-site independent research network managing 28 concurrent studies across multiple therapeutic areas with a 15-person distributed team requiring coordination across geographic locations and different operational cultures.
Before Implementation
- Cross-site coordination: Daily email updates with frequent version conflicts and communication delays
- Startup consistency: 45-day variation between fastest and slowest sites creating sponsor relationship challenges
- Knowledge management: Critical processes trapped in individual spreadsheets with personnel dependency risks
- Sponsor satisfaction: 72% rating in site performance surveys with communication issues cited frequently
After Implementation (6 months later)
- Real-time visibility: Network-wide dashboard providing all stakeholders with current status and progress metrics
- Startup consistency: 12-day variation representing 73% improvement in standardization across network sites
- Standardized processes: Reusable templates and workflows ensuring consistent quality and reducing training requirements
- Sponsor satisfaction: 91% rating with significantly improved communication and transparency feedback
Implementation Strategy: The network adopted a cloud-based platform with mobile access capabilities, using a pilot site approach for initial validation before network-wide deployment. Change management focused on a site champion program with peer mentoring and integrated sponsor portal functionality for improved external communication.
Case Study 3: Multi-Site CRO Implementation
Enterprise Profile: Regional Contract Research Organization managing 67 research sites with 180+ active studies across multiple therapeutic areas, requiring standardization while maintaining site-specific flexibility and sponsor-specific requirements.
Before Implementation
- Site operational variation: Each location used different tracking methods creating quality and efficiency inconsistencies
- Quality consistency: 34% variation in startup times across sites affecting sponsor relationships and contract negotiations
- Sponsor reporting: Manual compilation from 67 different sources requiring significant administrative overhead
- Staff turnover impact: 6-8 week knowledge transfer periods for new coordinators due to site-specific processes
After Implementation (12 months later)
- Operational standardization: Uniform processes and reporting across all sites while maintaining necessary flexibility
- Quality improvement: 11% variation in startup times representing 68% improvement in consistency
- Automated reporting: Real-time sponsor dashboards and automated alerts eliminating manual compilation
- Onboarding efficiency: 2-week new coordinator training program with standardized processes and documentation
Enterprise Implementation Approach: The CRO invested in a custom CTMS platform with extensive API integration capabilities, implementing an 18-month phased rollout with regional training teams and ongoing support resources. The approach included 480 hours of network-wide training investment and comprehensive change management with regional coordination.
Stakeholder Takeaways

Research Sites
Excel and Google Sheets remain valuable tools for specific use cases, but recognize their operational limitations at scale and complexity. When managing 3+ concurrent studies or coordinating 5+ team members, evaluate purpose-built systems that integrate with existing workflows while improving efficiency, compliance, and sponsor communication.
Key Focus Areas: ROI calculation based on hidden costs, phased implementation to minimize disruption, integration with existing EMR and regulatory systems, and staff training that builds on existing skills while introducing new capabilities.
Sponsors
Understand that research sites using advanced operational systems typically deliver faster startup times, better communication, and more reliable data quality. Consider site operational maturity as a selection criterion and provide study requirements in formats that support both spreadsheet and system-based sites during industry transition periods.
Key Focus Areas: Site capability assessment beyond traditional metrics, support for site technology adoption through training and resource sharing, standardized data exchange formats, and recognition of operational excellence in site selection and retention decisions.
CROs & AMCs
Standardize operational approaches across your site network while maintaining necessary flexibility for site-specific requirements and sponsor preferences. Invest in comprehensive training and change management resources to support sites transitioning from spreadsheet-dependent to more sophisticated operational systems.
Key Focus Areas: Network-wide standardization with local flexibility, comprehensive training programs and ongoing support, performance benchmarking and best practice sharing, and integration strategies that work across diverse site environments and technology capabilities.
Frequently Asked Questions
Research sites managing 1-2 concurrent studies with single-user coordination can effectively use spreadsheets with proper templates, data validation, and backup procedures. The critical tipping point typically occurs at 3+ concurrent studies or when multiple people need simultaneous access to the same operational data. Small sites should focus on optimizing their spreadsheet processes while planning for future growth and complexity.
Calculate your annual hidden costs by multiplying coordination time by hourly rates and adding error correction overhead. If spreadsheet-related operational costs exceed $15,000 annually for independent research sites or $40,000 for Academic Medical Centers, purpose-built system investment typically achieves positive ROI within 18 months while providing ongoing operational improvements and scalability benefits.
Most modern clinical trial management platforms offer comprehensive data import tools for Excel and CSV files with mapping capabilities for complex spreadsheet structures. Plan for data cleaning and validation during migration, including verification of formulas, conditional formatting rules, and data relationships. Consider running parallel systems for 30-60 days to ensure accuracy and completeness before fully transitioning to the new platform.
Choose platforms with robust data export capabilities, established user bases, and clear data portability policies. Request detailed information about data backup procedures, export formats, and business continuity plans during vendor evaluation. Consider vendors with strong financial backing, diverse customer bases, and established track records in the clinical research industry.
Typical ROI realization occurs within 12-18 months for most clinical research sites, with operational improvements becoming visible within 3-6 months of full implementation and team training completion. The timeline depends on implementation approach, change management effectiveness, system complexity, and team adoption rates. Sites with comprehensive training programs and strong leadership support typically see benefits earlier in the timeline.
Next Steps and Resources
Immediate Actions
📊 Complete Complexity Assessment
Use our detailed scoring framework to evaluate your current spreadsheet setup across all operational areas. Track your actual time spent on coordination, error correction, and manual processes for two weeks to establish baseline measurements.
📋 Review Platform Features
Discover the top 5 essential features Academic Medical Centers need in a site activation platform to streamline study startup and reduce delays. This visual guide helps you evaluate which platform capabilities matter most for replacing spreadsheet-dependent operations.
Get Platform Features Guide🔍 Evaluate Options
Request demonstrations from 2-3 platforms that match your complexity level and operational requirements. Focus on platforms that offer pilot programs or trial periods for hands-on evaluation with your actual workflows.
Free Resources
Get Expert Guidance
Ready to move beyond spreadsheet limitations and streamline your clinical research operations?
Request TrialConnx Consultation
See how purpose-built clinical trial management systems can eliminate spreadsheet chaos while improving study startup efficiency and sponsor relationships.