Prefer the visual version? View the slide deck ↓
Quick Answer
CTMS platforms manage what happens after a study activates: patient screening and enrollment, patient visits, financial milestones. Study startup is a different phase with different workflows, different users, and different bottlenecks. The industry median for startup is 89 days (Tufts CSDD, 2024), and 28 to 34 percent of that time is lost in internal handoffs that CTMS platforms don’t track. Purpose-built startup tools close that gap by giving sites visibility into pre-activation coordination before the first patient is ever enrolled.
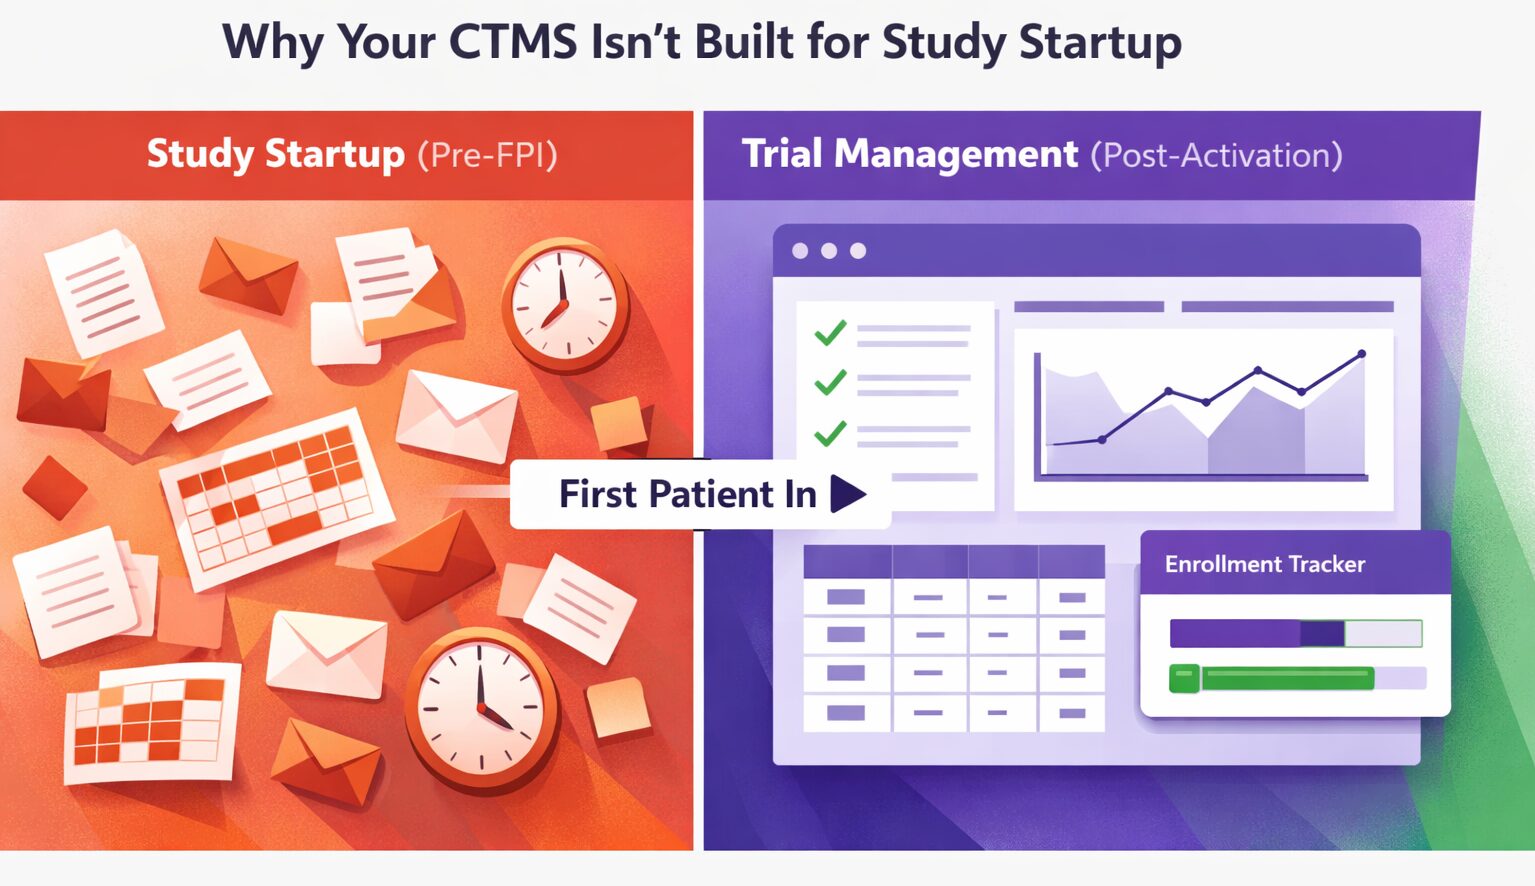
What your CTMS does well
CTMS platforms solve real problems. They track patient enrollment. They schedule patient visits. They track financial milestones and data collection workflows. For multi-site trials, they coordinate activities across dozens of locations.
These are valuable functions. If you’re running active studies, your CTMS is probably the system your CRCs and data managers live in daily.
But here’s what these systems have in common: they’re built for what happens after a study activates. After the site is green-lit. After first patient in.
The phase before that? That’s a different problem entirely.
The phase your CTMS doesn’t cover: Study Startup
The pre-FPI (First Patient In) phase covering IRB/ethics submissions, contract and budget negotiations, feasibility assessments, site initiation visits, regulatory document collection, and staff training. Everything that must happen before a study can enroll its first patient.
Before your CTMS even becomes relevant, your site must navigate regulatory submissions, contract redlines, budget creation, feasibility questionnaires, and cross-functional coordination across multiple departments. These are parallel workstreams with daily handoffs, not linear milestones with periodic updates.
Most sites manage this phase with spreadsheets, email threads, and institutional memory. It works when you have one or two studies in startup. It breaks when you have three or more. For a deeper look at where startup time actually goes, see our breakdown in Inside the Study Start-up Timeline.
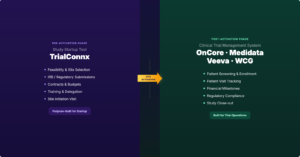
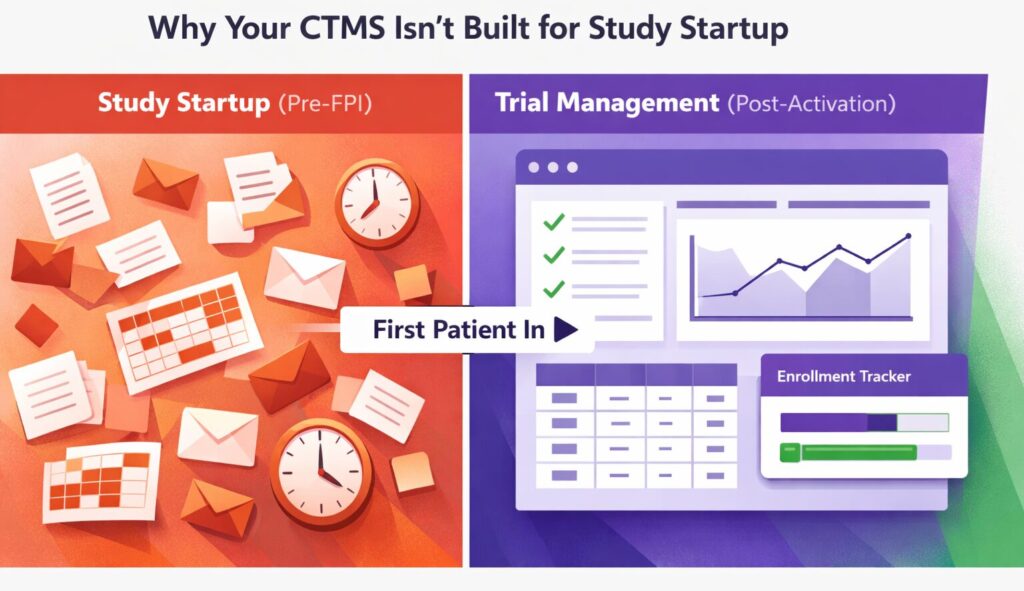
Two different phases, two different problems
Some CTMS vendors offer startup tracking as an add-on. On paper, it checks the box. In practice, it’s a milestone list bolted onto a system designed for a fundamentally different workflow. Here’s why the architectural mismatch matters:
| Dimension | CTMS (Post-Activation) | Study Startup (Pre-FPI) |
|---|---|---|
| Primary users | CRCs, data managers | Regulatory coordinators, study managers, PIs |
| Workflow type | Linear milestones | Parallel workstreams |
| Key challenge | Compliance and data quality | Coordination and handoffs |
| Update cadence | Per visit or event | Daily, multi-stakeholder |
| Success metric | Enrollment targets met | Time to activation reduced |
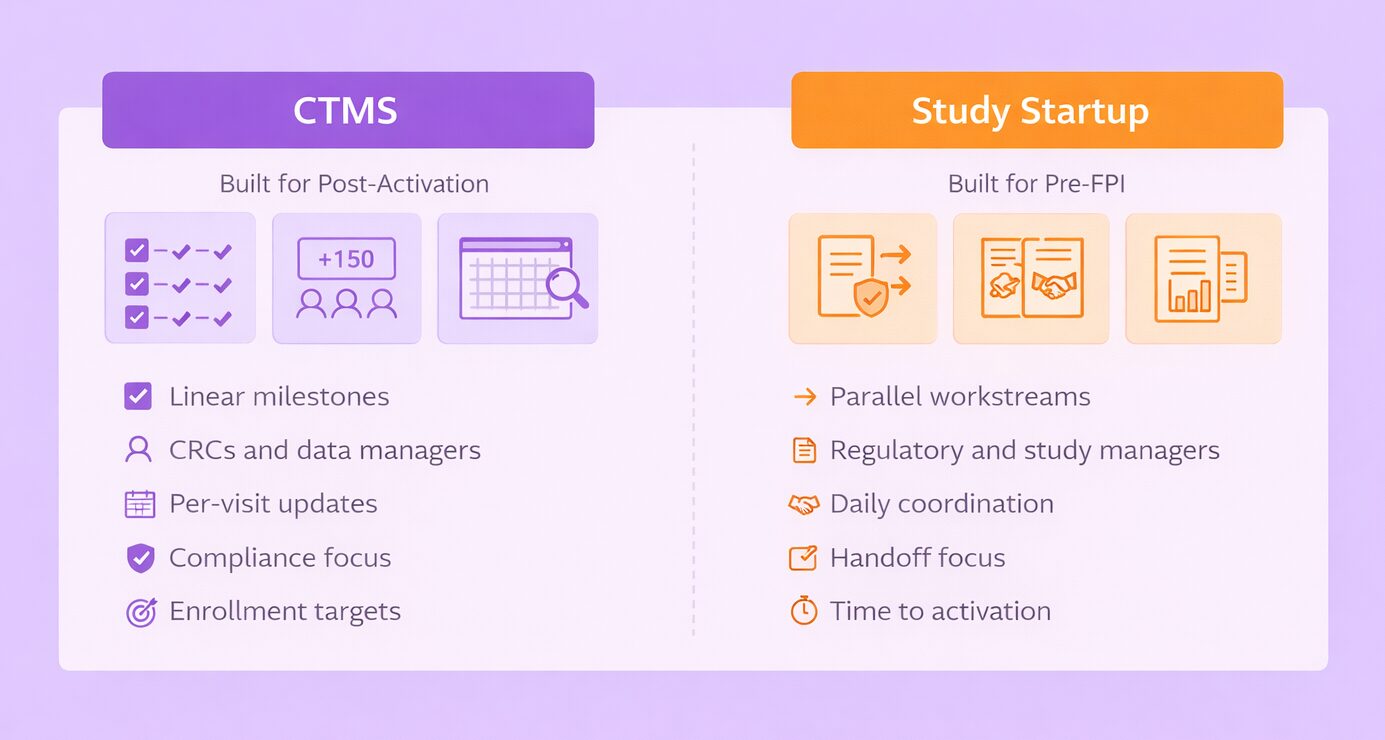
Study startup requires managing regulatory submissions, contract redlines, budget creation, and feasibility responses in parallel, often across multiple studies at once. CTMS tools track milestones sequentially. That’s the core mismatch.
Pro Tip: Track “time in stage” separately from “time between stages.” The gap between stages reveals handoff problems that milestone tracking masks entirely.
The cost of this gap: 89 days
Now that the mismatch is clear, here’s what it costs. According to Tufts CSDD (2024), the industry median for study startup is 89 days. Sponsors are increasingly pushing for 60-day activations. That 29-day gap is what sites absorb through workarounds, late nights, and shortcuts.
With no system managing pre-activation coordination, here’s where 89 days go:
| Delay Source | Share of Total | Days Lost | Controllable? |
|---|---|---|---|
| Internal handoffs | 28-34% | 25-30 days | Yes |
| IRB review cycle | 22-31% | 20-28 days | Partially |
| Sponsor contract negotiations | 20-28% | 18-25 days | Partially |
| External vendors (labs, equipment) | 13-20% | 12-18 days | No |
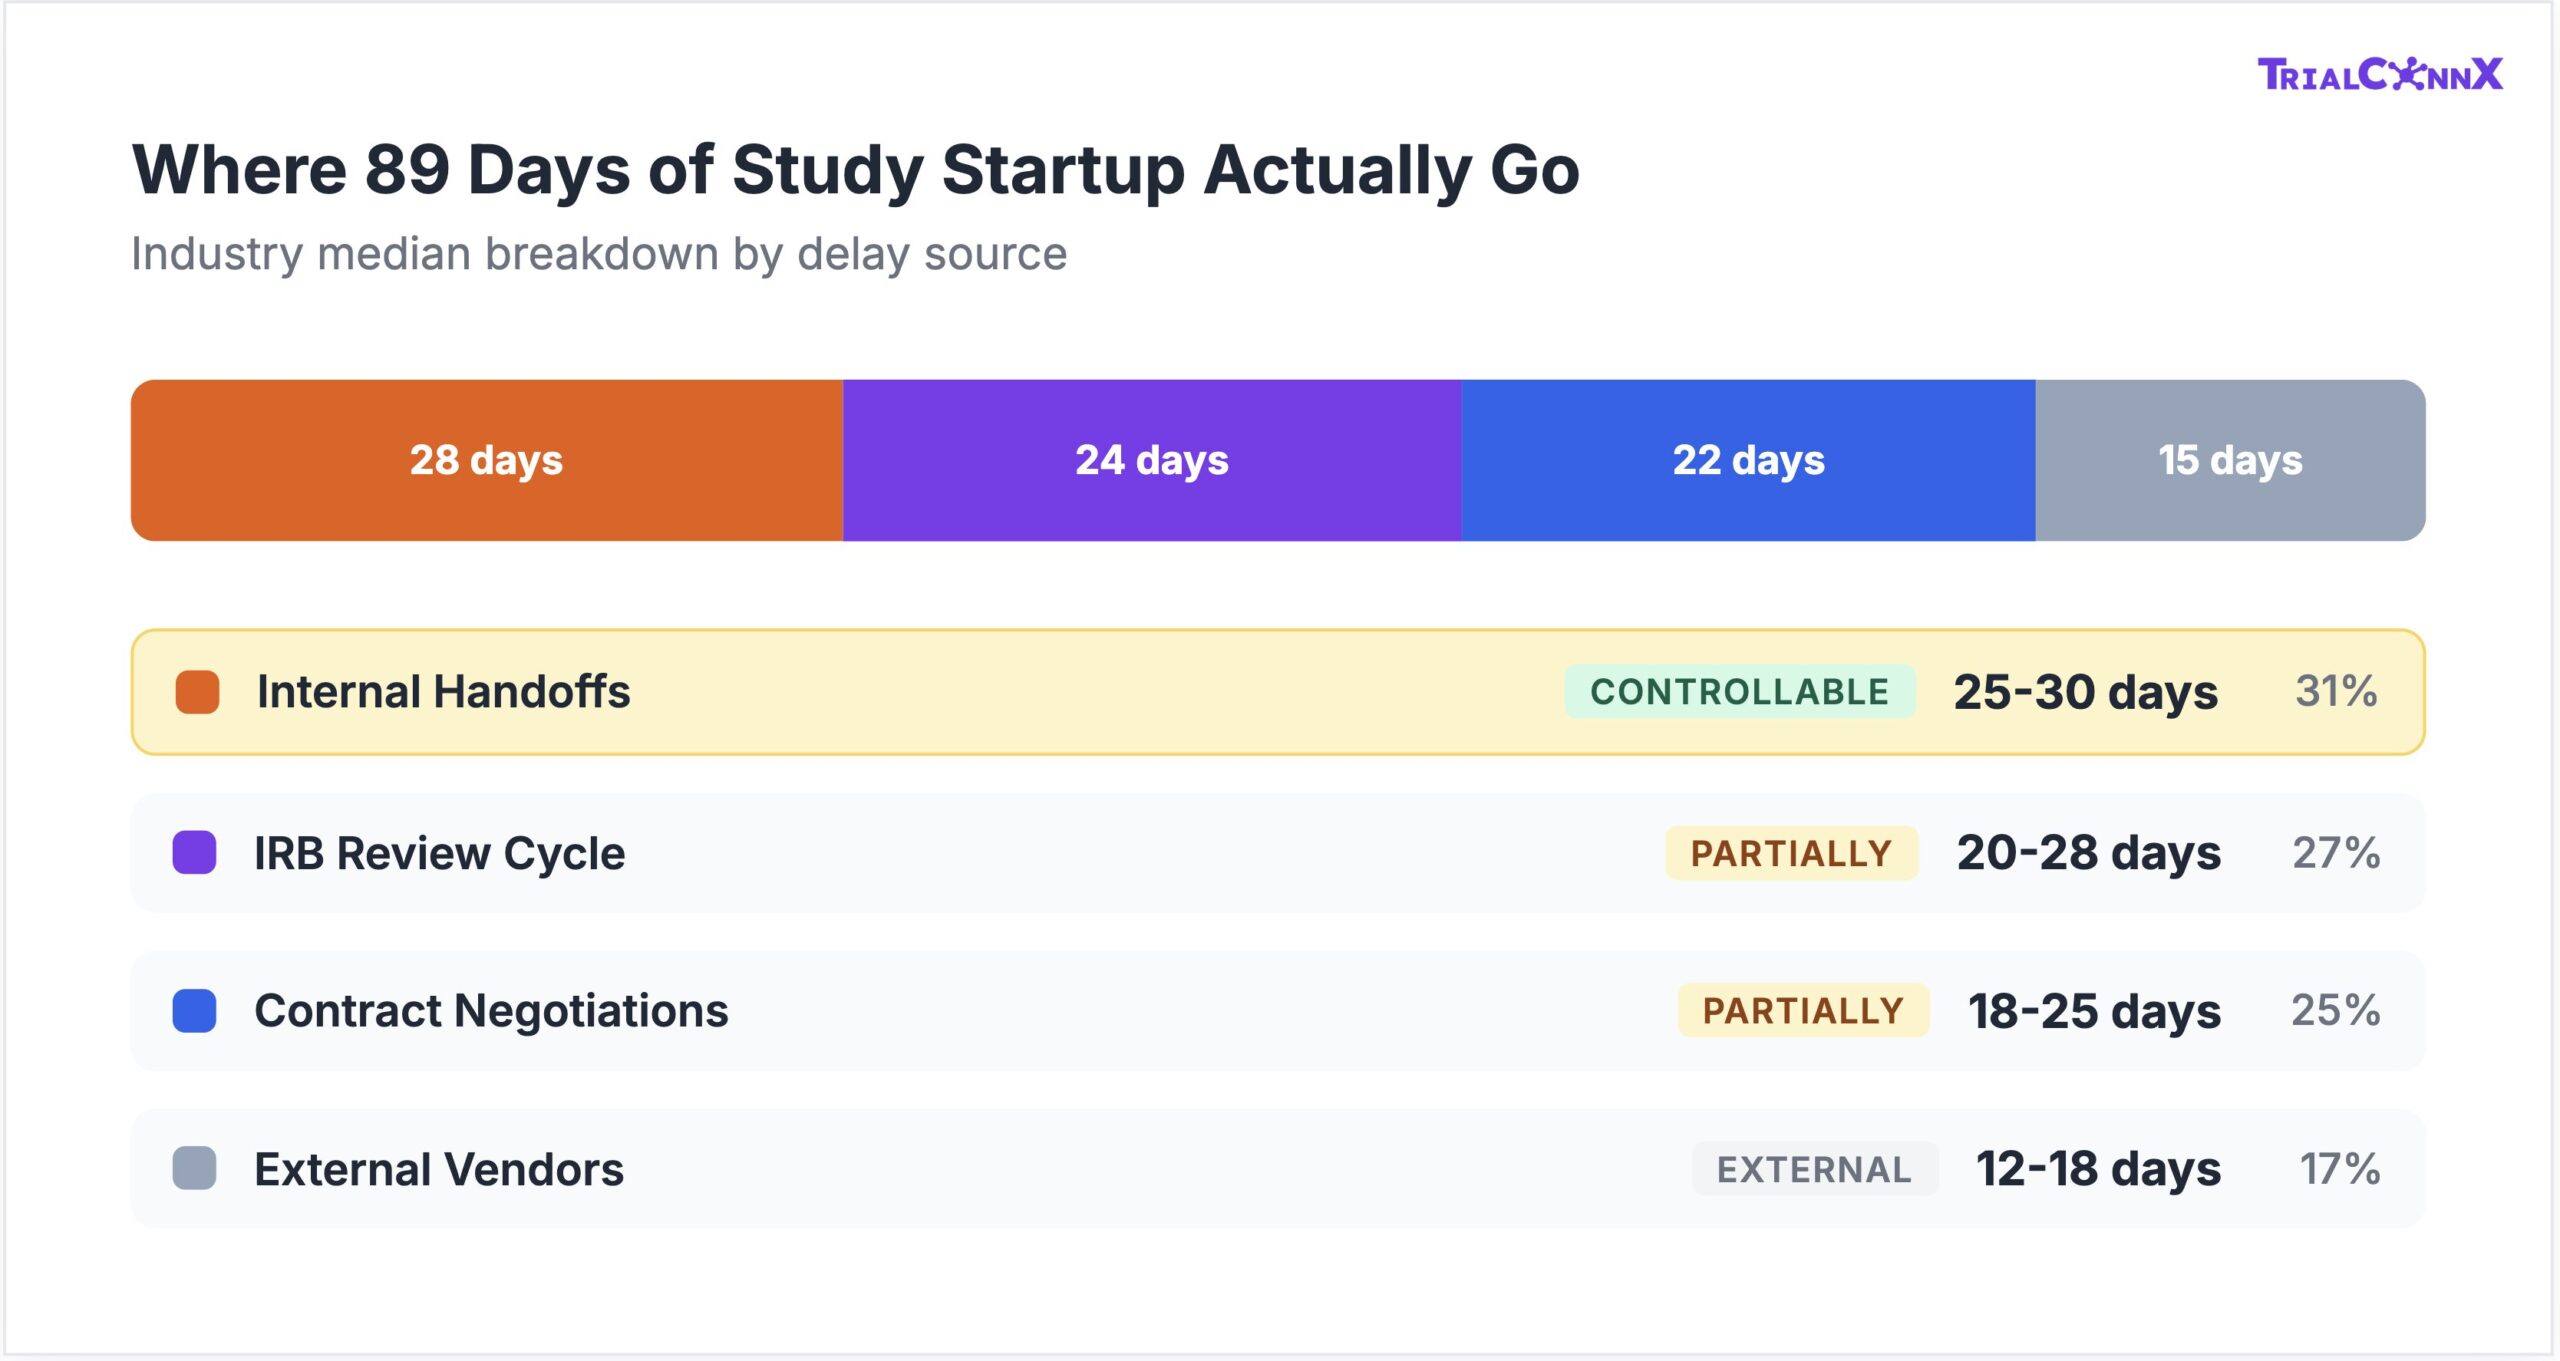
The single biggest controllable category is internal handoffs. A regulatory packet waiting on a signature. A budget shell that can’t start because someone is waiting for information from a meeting that hasn’t been scheduled. A feasibility response sitting in a queue because the coordinator is buried in IRB prep for a different study.
The Invisible Gap
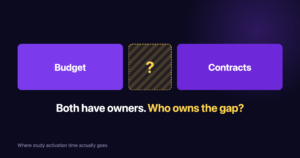
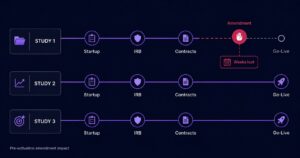
CTMS platforms can tell you a contract was executed. They can’t tell you why it took 22 days, where it sat idle for 11 of those days, or that the delay cascaded into a missed IRB submission window. Milestone tracking captures outcomes. Startup visibility captures the process between milestones, and that’s where the weeks disappear.
What happens when you scale without closing this gap
When startup coordination has no system behind it, problems stay hidden until they become crises. And the more studies you add, the faster it unravels.
The complexity ceiling
One study? You manage it from memory. Two studies? A spreadsheet works. Three or more concurrent startups? That’s where the system breaks.
One research site went from managing 2 concurrent startups to 5 without changing their coordination approach. Their CTMS handled the post-activation side fine. But with nothing managing the pre-FPI chaos, activation time jumped 64 percent, from 72 days to 118. Feasibility responses went from 3 days to 9. Status meetings ballooned from 1.5 hours per week to 6 hours.
We’ve written in detail about this pattern in What Breaks First When Sites Run Multiple Studies in Parallel.
Longer activation time when scaling from 2 to 5 studies
Increase in feasibility response time under load
Increase in weekly meeting overhead
IRB quality erosion
When coordinators are stretched across multiple startups, submission quality drops. Sites that take time to prepare complete packages see a 78 percent first-pass approval rate. Rushed submissions land at 52 percent. That 26-percentage-point gap translates to 13 or more additional days per study in revision cycles.
Most of these revision triggers are predictable and preventable. We covered the seven most common ones in Why Site IRB Submissions Fail the First Time.
Feasibility pipeline damage
Feasibility is your pipeline. Every delayed response is a potential study you don’t get. When coordinators are buried in active startup work, feasibility responses slow from 3 days to 9. That’s not a minor inconvenience. Sponsors notice. For practical strategies to protect your response times, see How to Cut Feasibility Response Times in Half.
Rushed startup damages post-activation too
Here’s the part that connects back to your CTMS. Rushed startup doesn’t just delay activation. It creates problems that show up in your post-activation data: protocol deviations, monitor findings, staff turnover. The damage surfaces in your CTMS, but the root cause is upstream.
Of protocol deviations trace back to inadequate startup preparation
Of CRCs cite burnout as primary reason for leaving clinical research
Sources: ACRP Quality Benchmarking Survey (2023); ACRP Workforce Survey (2024)
One research site managing 8 concurrent studies on compressed timelines saw a 23 percent protocol deviation rate and 12 monitor observations per study. Staff turnover hit 28 percent annualized. Two resignations in 12 months.
After implementing structured startup management with clear stage gates, handoff ownership, and visibility into workload distribution, their deviation rate dropped to 9 percent. Monitor observations fell to 0.4 per study. Turnover dropped to 11 percent.
Before: No Startup System
- 23% protocol deviation rate
- 12 monitor observations per study
- 28% annualized staff turnover
- 2 resignations in 12 months
After: Structured Startup
- 9% protocol deviation rate (61% reduction)
- 0.4 monitor observations per study (97% reduction)
- 11% annualized staff turnover (61% reduction)
- Zero resignations in the following period
The tradeoffs sites make to hit deadlines are real. We explored this pattern in The Unspoken Tradeoffs Sites Make to Hit Startup Timelines.
What purpose-built study startup tools actually do
A dedicated startup tool isn’t a fancier spreadsheet. It’s a system designed specifically for the pre-activation phase, built around the coordination challenges that CTMS platforms were never meant to solve.
See where every study stands across regulatory, contracts, budgets, and feasibility in one view. Not just milestone checkboxes, but actual task-level progress with time-in-stage tracking.
Decouple sequential dependencies. Start budget shells before all information arrives. Run regulatory and contracting in parallel instead of waiting for one to finish before starting the next.
Measure time in stage and time between stages. Identify whether delays are process flaws, training issues, or unrealistic timelines. Fix the right problem instead of guessing.
Trigger alerts when tasks exceed expected durations, before they become delays. Give staff a safety net to flag upstream blockers instead of absorbing them silently.
Manage 5, 10, or 15 concurrent startups without multiplying your weekly meetings. Replace 6 hours of status calls with 45 minutes of dashboard review.
What this looks like in practice
One Academic Medical Center’s Experience
A major academic medical center and NCI-designated cancer center mapped their first three studies into a purpose-built startup tool. Within weeks, they discovered something their CTMS had never surfaced: lab manuals from sponsors weren’t arriving for three or more months into the activation process. That delay had been silently inflating their timelines without anyone realizing it.
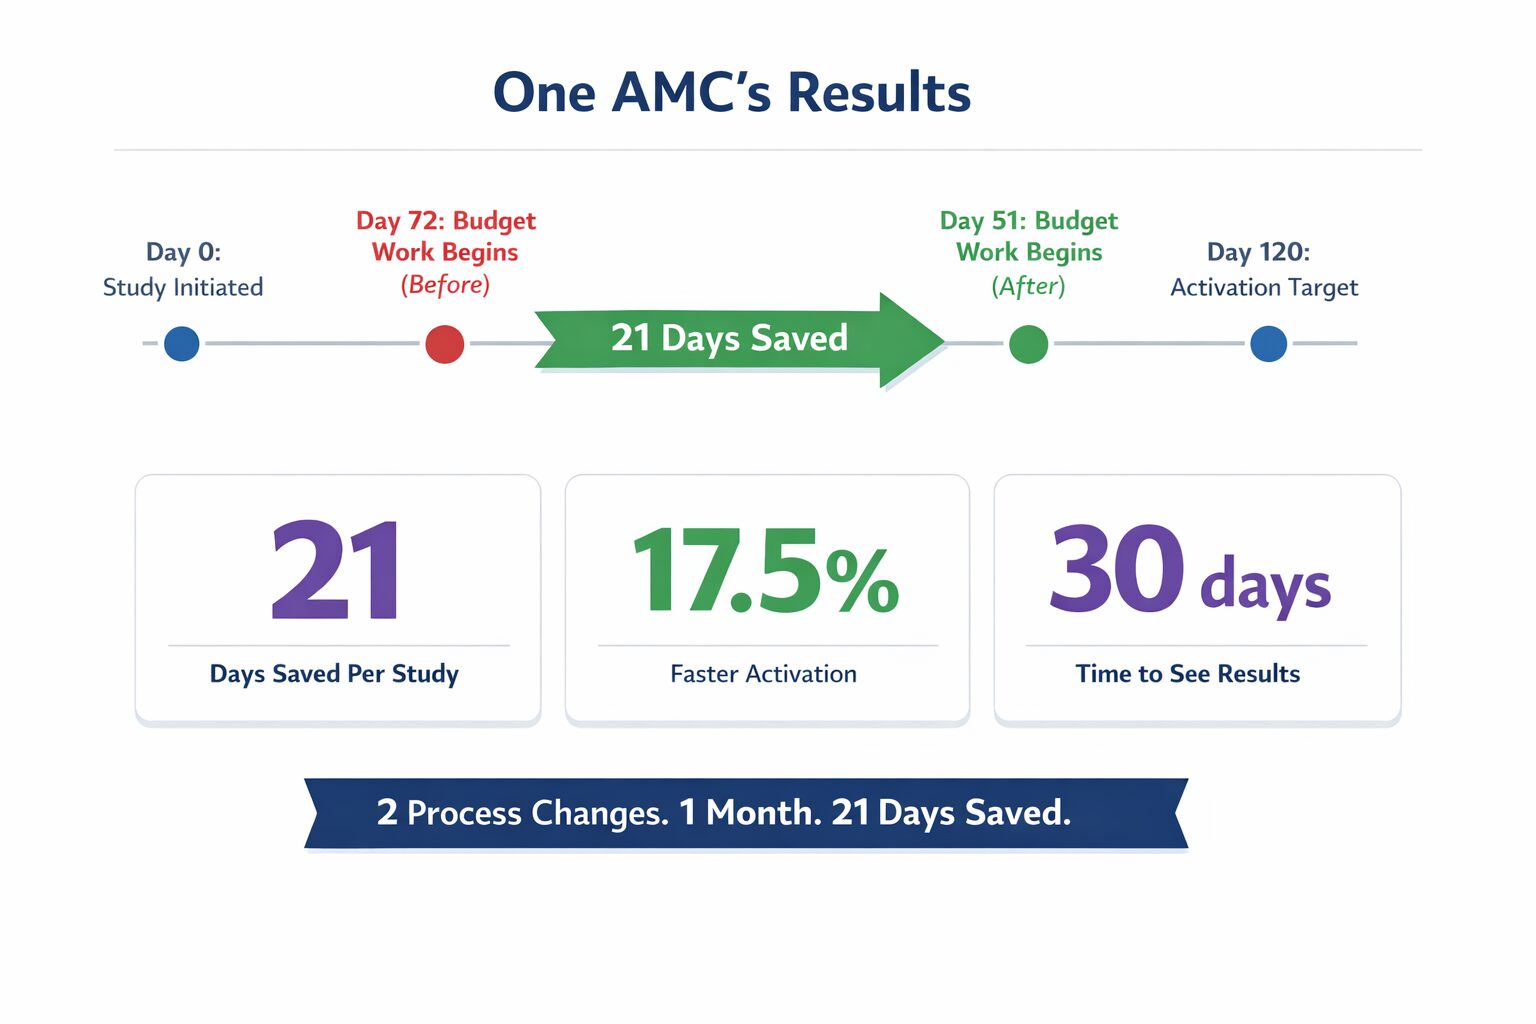
The data also revealed that budget work couldn’t start until Day 72 of a 120-business-day activation target. Sixty percent of their timeline was consumed before core work could begin.
“We weren’t able to start our budget until Day 72 and we are charged with opening within 120 business days.”
Central Office Leadership
Armed with this visibility, they made two targeted changes: moved budget shell creation earlier in the process and restructured the timing of their resource meetings to eliminate a 29-day wait to get in front of the PI.
Saved per study
Faster activation
Time to see results
Two process changes. One month. Twenty-one days saved. The tool didn’t change their processes directly. It gave them the visibility to see where the time was going and the data to act with confidence.
For a broader look at moving from manual tracking to structured systems, see From Spreadsheets to Systems.
How to evaluate whether you need a dedicated startup tool
Not every site needs specialized startup software. If you run one or two studies at a time and your activation timelines are within industry benchmarks, your current approach may be working fine.
But if any of the following sound familiar, the gap between your CTMS and your startup workflow is likely costing you weeks per study:
- You run 3 or more concurrent study startups
- Your activation timelines consistently exceed industry median
- You can’t answer “where is Study X in startup?” without calling a meeting or checking multiple spreadsheets
- Your IRB first-pass approval rate is below 70 percent
- Feasibility responses take longer than 5 business days
- Staff are working evenings or weekends to meet startup deadlines
Where do you stand? Phase-specific benchmarks
| Study Phase | Top Quartile | Industry Median | Bottom Quartile |
|---|---|---|---|
| Phase 1 | 30-40 days | 45-55 days | 70+ days |
| Phase 2 | 45-55 days | 60-75 days | 90+ days |
| Phase 3 | 50-60 days | 70-89 days | 100+ days |
| Phase 4 | 35-45 days | 50-65 days | 80+ days |
Source: Phase-specific benchmarks from industry analyses (Tufts CSDD, AACI 2024)
If your Phase 3 startups consistently exceed 89 days, you’re operating below industry median. The question isn’t whether you have a CTMS. It’s whether you have anything managing the 89 days before your CTMS becomes relevant.
For help identifying which metrics matter most, see 5 Study Startup Metrics That Actually Predict Delays. And if you’re still deciding whether your spreadsheet-based approach is sustainable, we addressed that directly in Are Spreadsheets Enough for Tracking Study Startup?
Want to see where your startup time is actually going?
Frequently Asked Questions
What is the difference between CTMS and study startup software?
CTMS (Clinical Trial Management System) manages post-activation trial operations: patient enrollment, patient visits, financial milestones and data collection. Study startup software manages the pre-FPI phase: regulatory submissions, contract and budget negotiations, feasibility assessments, and the internal coordination across parallel workstreams that must happen before a study can enroll patients. They cover different phases of the study lifecycle.
Can my CTMS handle study startup?
Most CTMS platforms include basic milestone tracking for startup activities. But they don’t manage the daily coordination, parallel workflows, and handoff visibility that drive startup efficiency. If your team still uses spreadsheets and email to track startup tasks alongside your CTMS, that’s the gap. The startup phase needs task-level tracking, time-in-stage measurement, and cross-functional coordination that milestone-based systems aren’t designed to provide.
How long should study startup take?
The industry median is 89 days according to Tufts CSDD (2024), but this varies significantly by study phase. Top-quartile Phase 3 sites activate in 50-60 days. Phase 1 studies can be activated in 30-40 days at high-performing sites. If your startups consistently exceed the median for your study phase, it’s worth examining where time is being lost, particularly in internal handoffs, which account for 28 to 34 percent of total startup time and are the most controllable delay category.
What signals indicate I need a dedicated study startup tool?
Key indicators include: activation times above industry median for your study phase, IRB first-pass approval rates below 70 percent, feasibility response times above 5 business days, inability to answer study status questions without meetings or checking multiple spreadsheets, and staff regularly working outside normal hours to meet startup deadlines. If you’re managing 3 or more concurrent startups, the coordination complexity typically exceeds what manual tracking can handle effectively.
Does a study startup tool replace my CTMS?
No. A study startup tool complements your CTMS by managing the pre-activation phase. Think of it as covering the first half of the study lifecycle: everything from feasibility through site activation. Once a study activates and moves into enrollment, the CTMS takes over. The two systems address different phases with different operational requirements, different primary users, and different success metrics.
Your CTMS manages trials. What manages your startup?
If your team spends more time coordinating startup in spreadsheets than in any formal system, you already know the gap exists. You just haven’t measured it yet.
Audit your last 5 study startups. Measure time in each stage and time between stages. The difference will tell you where the weeks are hiding.
Then ask yourself: is your CTMS solving this problem, or is it waiting for this problem to be solved before it can do its job?
Ready to Close the Startup Gap?
Discover how purpose-built startup tools give your site the visibility to cut weeks from activation timelines.
Visual Summary
Get the key points from this post in a swipeable slide deck. Download it or share it with your team.
Skip to PDF contentSources
- Tufts Center for the Study of Drug Development (2024). Study startup cycle time benchmarks.
- ACRP Quality Benchmarking Survey (2023). Protocol deviation root cause analysis.
- ACRP Workforce Survey (2024). Clinical research coordinator retention and burnout data.
- AACI Survey (2024). Site activation performance data for NCI-sponsored and industry-sponsored studies.